September 23, 2026
Gradient's New Expected Possession Value Model Explained
Announcements


Football is a low-scoring game, and finishing is noisy. A shot that goes in and a nearly identical shot that hits the post can reflect the same performance, but only one shows up in the match report. That makes goals and assists poor measures of performance on their own. Worse, they only reward the last two actions of what's often a much longer sequence. Expected Goals (xG) and Expected Assists (xA) fixed part of this. Instead of counting outcomes, xG estimates the probability a shot is scored given its context. Similarly, xA extends the same logic one step back: instead of crediting an assist only when the shot goes in, it credits the pass with the probability it will be an assist.
But xG and xA still only reach two actions deep. Everything earlier in the sequence, the line-breaking pass that broke the first line of defense, the carry that created space, still goes unvalued. That's the gap Expected Possession Value (EPV) models close, and our version is built on our unique combination of event data and broadcast tracking data.
Gradient’s EPV model estimates the probability that the given possession sequence ends in a goal, from any point within that sequence. It values every action by how much it moves that probability. This gives us two numbers for every event:
A positive EPV Added means the action improved the team's probability to score from that sequence; a negative one means it hurt their chances. Because EPV Added is denominated in probability of scoring a goal, it provides us with one common currency across the entire game. A pass worth 0.03 EPV Added raised the team's chance of scoring by three percentage points in that sequence, whether it happened in the Premier League or in Major League Soccer.
Gradient’s EPV Model
Possession value is one of the most established model families in football analytics. Every major provider has their own version, and several top clubs have built one internally. Existing versions typically rely on hand-engineered context features, and are built on either just event data or just broadcast tracking data. Our fully synchronized event and tracking dataset allows us to take a different approach.
Gradient's EPV model is built as a Graph Neural Network (GNN), and was developed in collaboration with UnravelSports. Players are represented as nodes, and the relative positions between them as edges. Instead of being told in advance which relationships matter, the model learns for itself which teammate, which defender, which part of the picture is relevant to each specific event. That means it can pick up on relationships nobody thought to hand-code, like a holding midfielder who's far from the ball but blocking the only passing lane forward. And because the model is attention-based, we can inspect which players it was actually weighing when it valued a given event. The model is trained on more than 4 million graphs, built from real match sequences across our covered competitions. It learns which relationships matter directly from how football actually unfolds, rather than leaning on someone's best guess about which distance or angle should matter.
An Example Sequence
The best way to see EPV in action is to look at how it works on a possession sequence that is clearly threatening, but ends up without even a shot.
Arsenal win back possession through a William Saliba interception, the start of a new possession sequence. Saliba passes to Kai Havertz, who then lays it off to Leandro Trossard. Trossard carries it forward and plays it into stride for Gabriel Martinelli, who crosses, and the sequence ends with the opposition goalkeeper claiming it comfortably. EPV puts tangible numbers on every event:
Each action's EPV Added is simply the difference between the EPV before and after it, so how much closer, or further, it took the team from scoring. The interception at the start and the cross at the end are the two boundary cases, where a possession changes teams: Southampton's EPV of 0.020 is negated at the start (a threat that gets erased is worth crediting to Saliba), and Southampton's EPV of 0.004 is negated again at the end (a threat that gets handed over is worth charging to Martinelli). Per player, summed across their events:
Three things stand out:
Using EPV
Because EPV and EPV Added are available at the event level, we can break down exactly how each player contributes through different elements of their game, rather than only looking at their overall total. Take crossing and dribbling: plotting EPV Added from each against the other shows whether a player creates value the same way, or through entirely different actions.
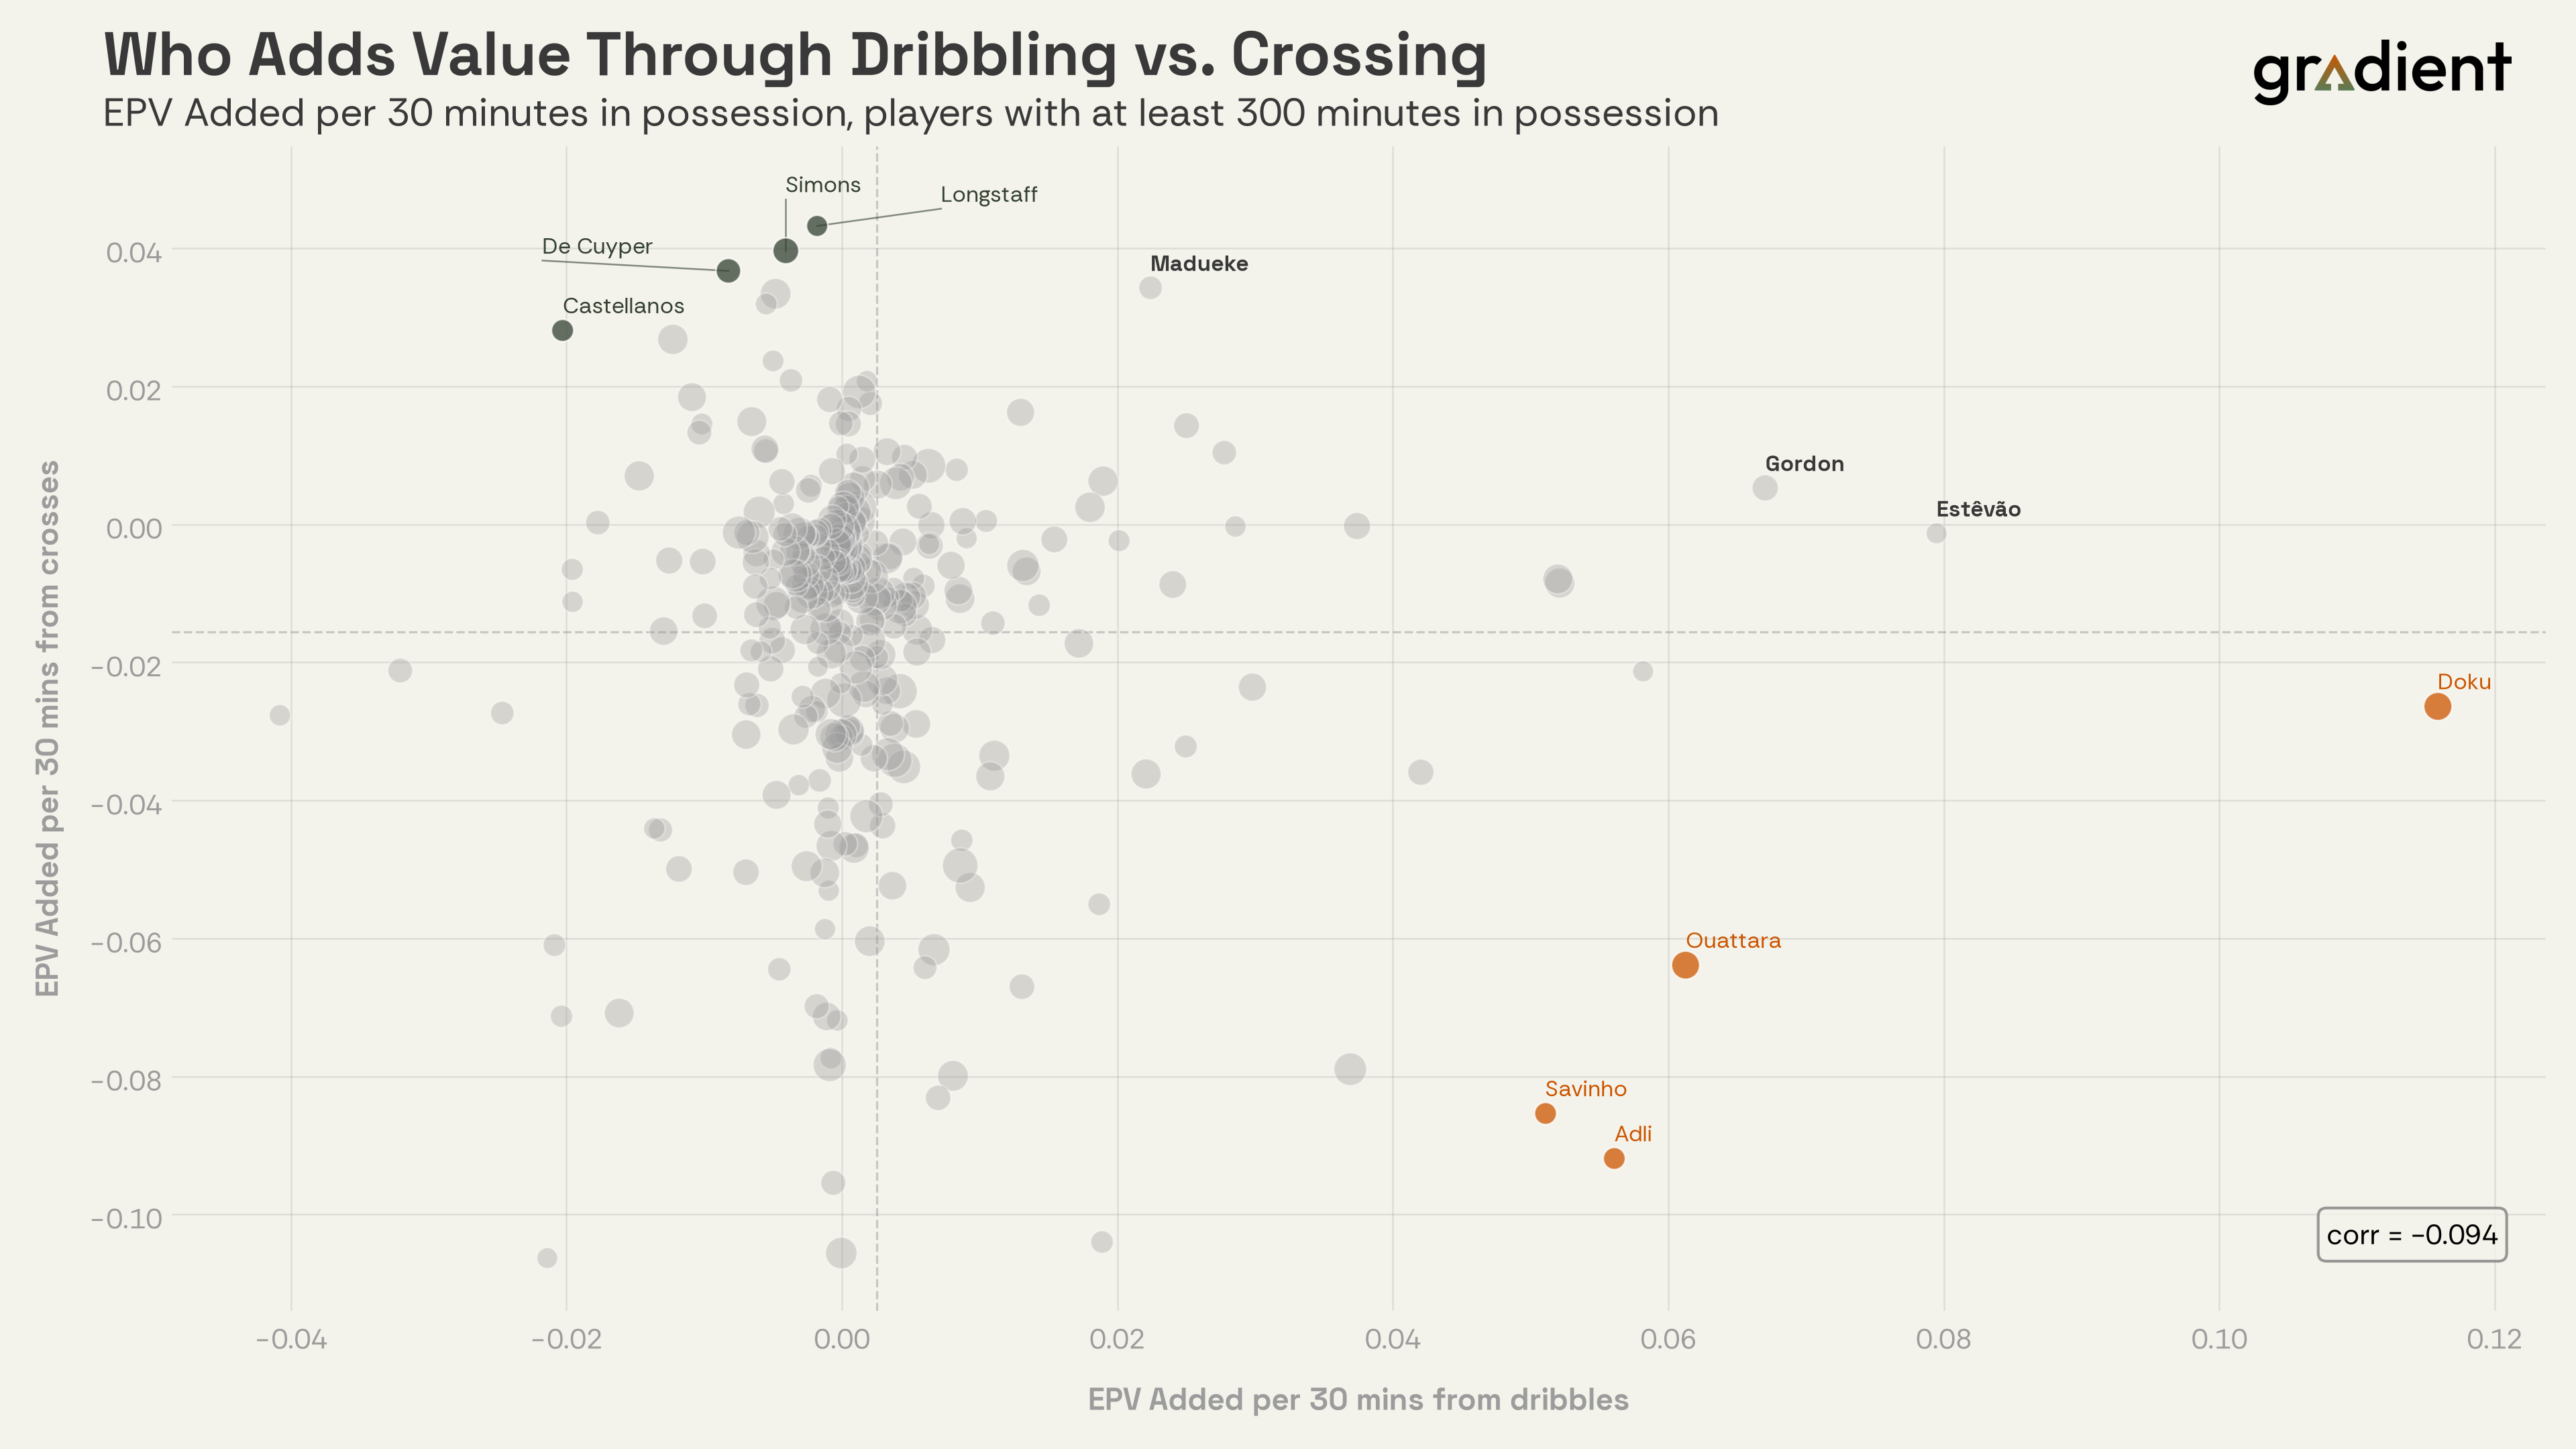
The plot shows that creating value from crosses and dribbles are two largely independent ways of contributing, with basically no correlation between them. Players who create the most value through dribbling aren't generally the same ones who do it through crossing.
Jérémy Doku sits in a class of his own on dribbling, adding roughly double what anyone else manages per 30 minutes in possession; only Estêvão and Anthony Gordon still have him in sight. Noni Madueke is the rare dual threat in this data set, adding value through both dribbling and crossing rather than leaning on one skill, and among qualified players with at least 300 minutes in possession he posts the most balanced positive contribution from both actions, trailing only high-volume dribble specialists like Doku and Estêvão in total combined output from these two event types.
At the other end, some players lean hard into one skill at the expense of the other. Dango Ouattara, Savinho and Amine Adli have the largest gap of anyone in the data, adding solid value through dribbling while contributing negatively through their crossing. The reverse holds for Sean Longstaff, Xavi Simons and Maxim De Cuyper: three players not typically thought of as crossers, all generating more value there than through dribbling.
What’s Next
EPV and EPV Added are now available at the event level through Gradient's REST API, with aggregated metrics coming to Epitome soon. But delivery is only the first piece of the puzzle, because EPV also gives us a new dimension for evaluating performance. One that gets more interesting once combined with Player Grades, and that combination is where we're headed next.