
June 25, 2026
Gradient FC’s Player Rankings: Explained
Player Rankings

Gradient Sports evaluates every player involved in every event, both on and off the ball, assigning more than 2,000 grades per match across 25 distinct grade categories.
Each action is assessed on a nine-point scale ranging from -2 to +2 in 0.5 increments. A grade of 0 reflects expected execution, while positive and negative grades indicate performance above or below expectation. This grading framework was originally developed by the team at Gradient’s sister company, PFF, and was quickly adopted by all 32 NFL teams along with more than 185 NCAA and Canadian football programs. Gradient has now adapted that same methodology for association football in partnership with some of the world’s largest clubs through its alpha program.
For clubs, Player Grades introduce a valuable layer to player evaluation that traditional data alone cannot provide. Conventional metrics are largely outcome-driven, capturing what happened on the pitch. Player Grades are built to show how well those actions were actually executed. That distinction matters. By focusing on execution rather than outcome alone, Player Grades offer a stronger signal in the transfer market, help separate sustainable performance from misleading production, and provide a clearer framework for understanding player quality. The result is a more complete view of performance, one that makes evaluation sharper, comparison easier, and the game itself more understandable.
Gradient remains committed to refining and advancing its methodology. As part of that ongoing evolution, the data science team has recently updated the player grading models to strengthen cross-competition comparisons and introduce new grades that deliver even deeper insight into player performance.
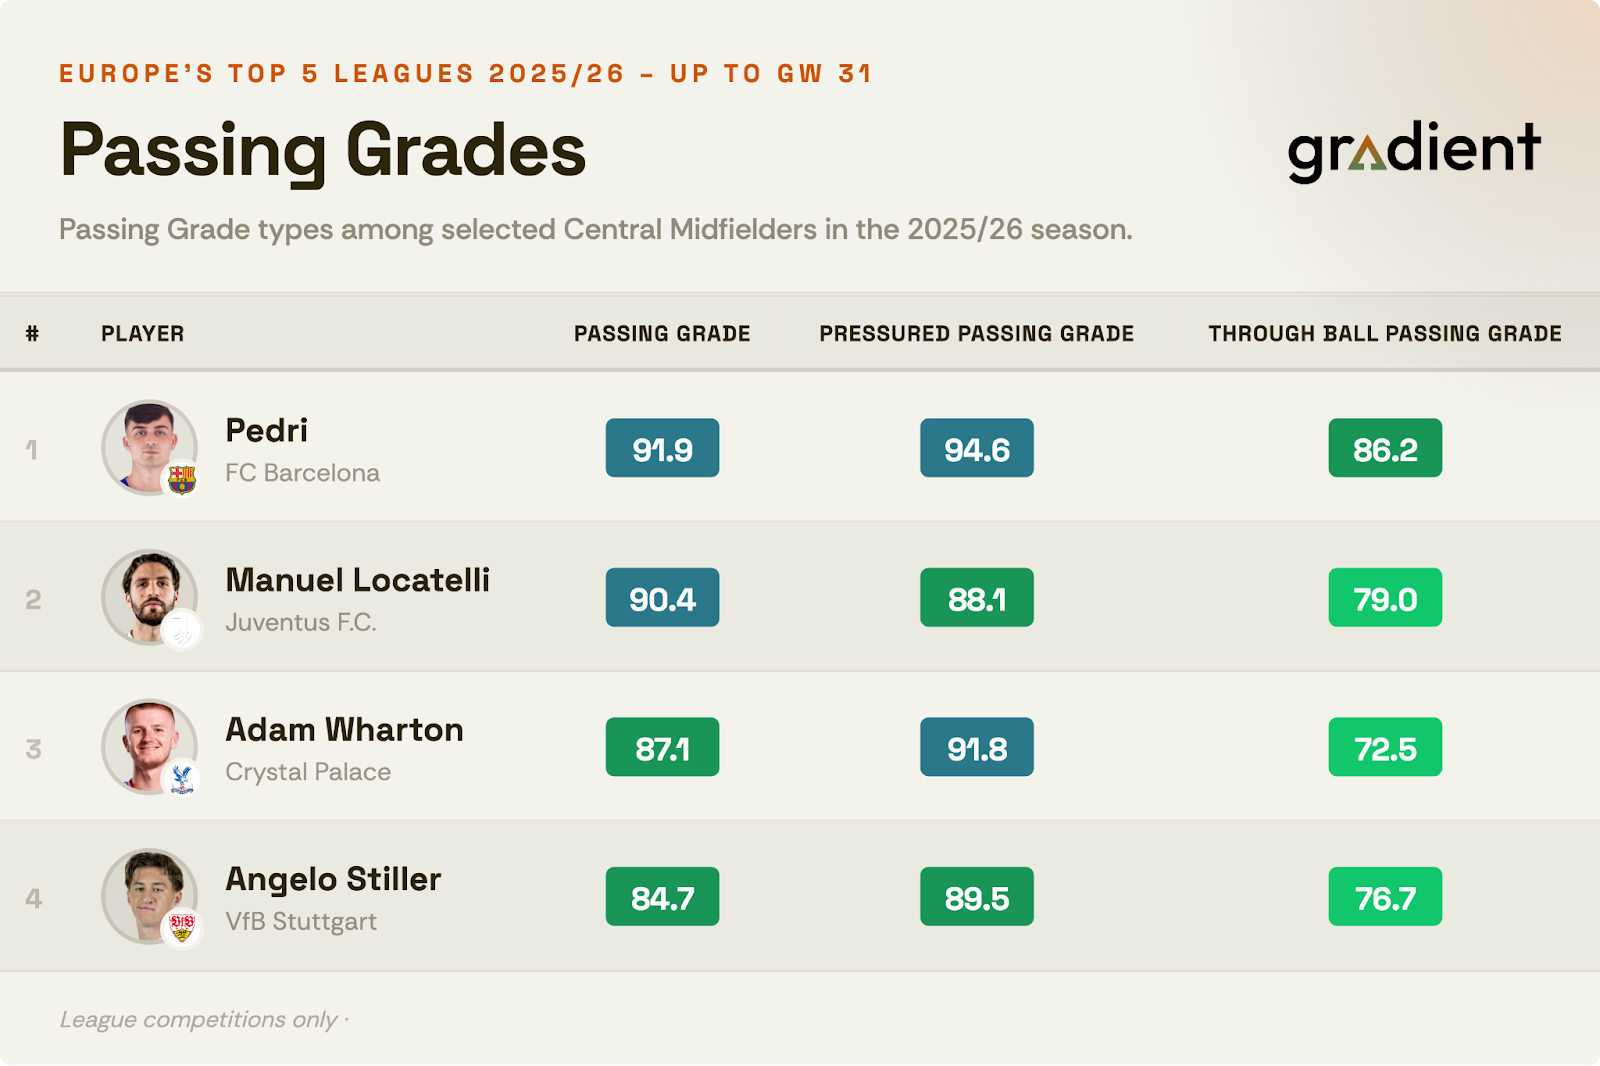
Previously, Player Grades were calculated at the competition and season level. This meant a player’s grade reflected their performance only relative to others within the same competition and season. As a result, comparisons across competitions or seasons were difficult, since each was based on a different distribution (e.g. an 85.0 Passing Grade in the Premier League was not directly comparable to an 85.0 in Serie A).
With the latest update, Player Grades are now calculated across all competitions and seasons. This creates a single, unified distribution across all Player Grades making cross-competition and cross-season comparisons much more relevant.
These changes mean achieving the highest grades is more challenging because players are now evaluated against a larger pool of their peers. For example, Bruno Fernandes through 30 games in the 2025/26 Premier League season previously recorded a 99.9 Passing Grade (the maximum possible). Under the new model, this adjusts to 90.5. This does not indicate a decline in performance but rather, it reflects a broader comparison set. His performance remains elite and still ranks as the best in the Premier League.
The process for calculating the final grades is divided into 3 steps: (1) Raw grades, (2) Grade normalization, (3) Aggregation and conversion. These steps provide a grade for each different skill (passing, shooting, crossing, etc.).
The first step in the grading process is the collection of ‘raw’ grades. Unlike other providers in the space, Gradient does not simply record that an event occurred, but rather assess the quality of the player’s performance within that event.
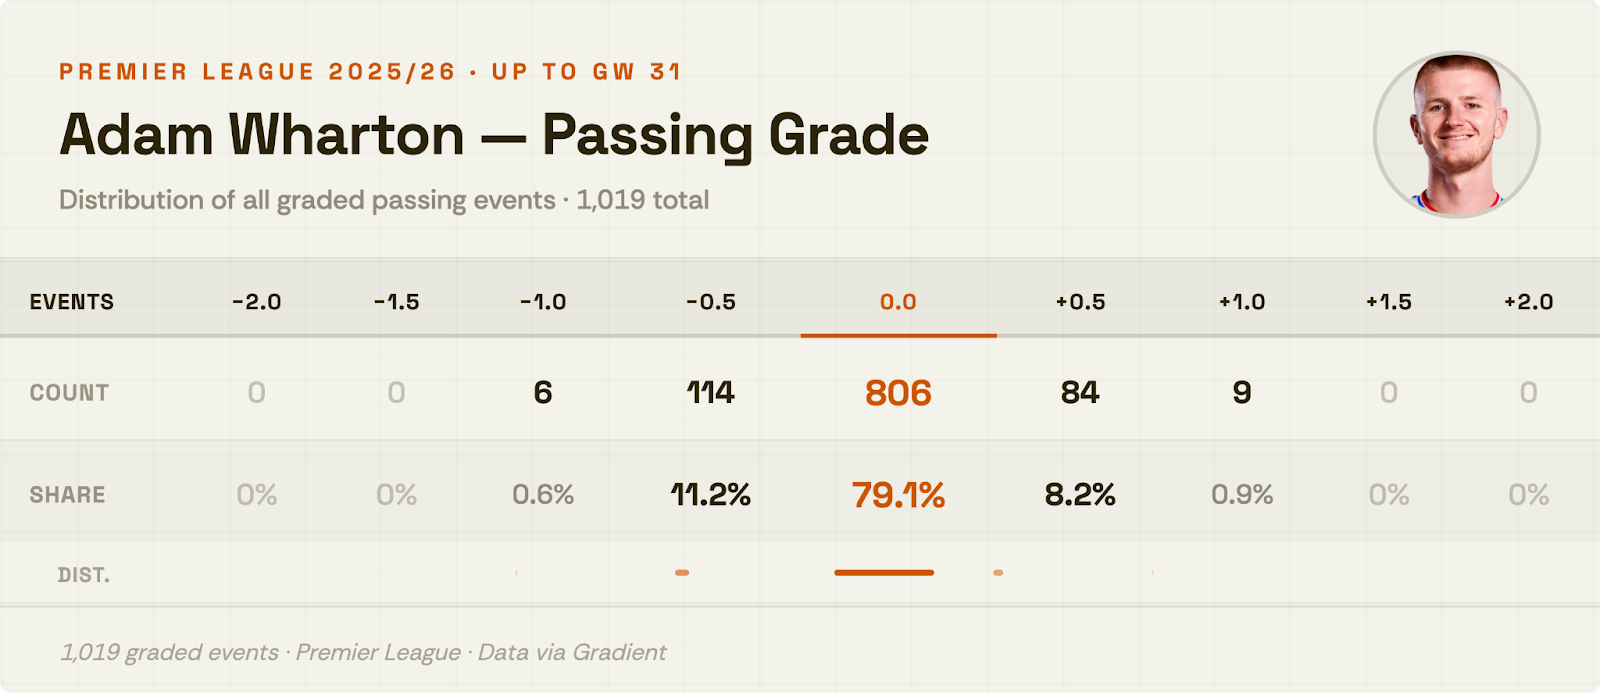
Player Grades surface context and execution using a 9-point scale ranging from -2 to +2 in 0.5 increments. A grade of 0 represents an expected outcome, while positive and negative grades reflect actions performed better or worse than expected. Grades are assigned whenever a player performs an action, both on the ball (e.g. passing, shooting, crossing, ball control, carrying, duels, challenges) and off the ball (e.g. movement and positioning). It is also important to note, that whilst the scale is numerical, it does not necessarily mean that a +1 grade is twice as good as a +0.5, it is simply the next grade up.
For example, consider a centre-back passing the ball on the halfway line. A routine, unpressured pass to an open teammate would receive a 0, as this meets the expectation of our expert Grading team. A precise, line-breaking pass under pressure would receive a positive grade. Conversely, an underhit pass to a teammate - even if completed - would receive a negative grade if it falls below the expected standard. This reflects our focus on evaluating performance rather than just outcomes.
The grading process is guided by detailed frameworks designed to minimise subjectivity and ensure consistency. Once raw grades are collected, they undergo multiple layers of quality control, including senior review of flagged actions, consistency checks, ongoing analysis, and dedicated quality assurance processes.
The result is a unique dataset that captures the quality of every action in a match, enabling us to measure performance relative to expectation in a way that the event-based metrics of Gradient’s competitors cannot.
Next, the raw grades are placed into context.
Alongside each raw grade, Gradient captures hundreds of additional contextual data points through event and broadcast tracking data. This allows us to understand the specific circumstances in which each action occurs and adjust grades accordingly.
These adjustments are made using statistical models applied to each facet. The models identify whether a situation is historically more or less favourable and apply a corresponding positive or negative adjustment.
For example, a ground pass is typically easier to execute than a pass on the half-volley. As a result, a half-volley pass may receive a small positive adjustment (e.g. +0.5 increasing to +0.55). Adjustments are intentionally small and are capped to ensure that a grade cannot move beyond its original band (e.g. a +0.5 will never be adjusted above +1.0).
Finally, while the raw grading scale uses numerical values, these should be interpreted as ordered categories rather than linear measures. Each step reflects a higher level of execution, but not in equal increments (i.e. a +1 is better than a +0.5, but not necessarily twice as good). To better reflect this, the models apply an additional transformation using logarithmic scaling and normalisation. This accounts for the relative rarity of higher grades and ensures that each value more accurately represents its true performance level.
After individual performances are evaluated, those assessments are rolled up into broader areas of the game, such as passing, shooting, and aerial duels, at both match and season level. Those results are then translated into an easy-to-understand 0 to 100 scale.
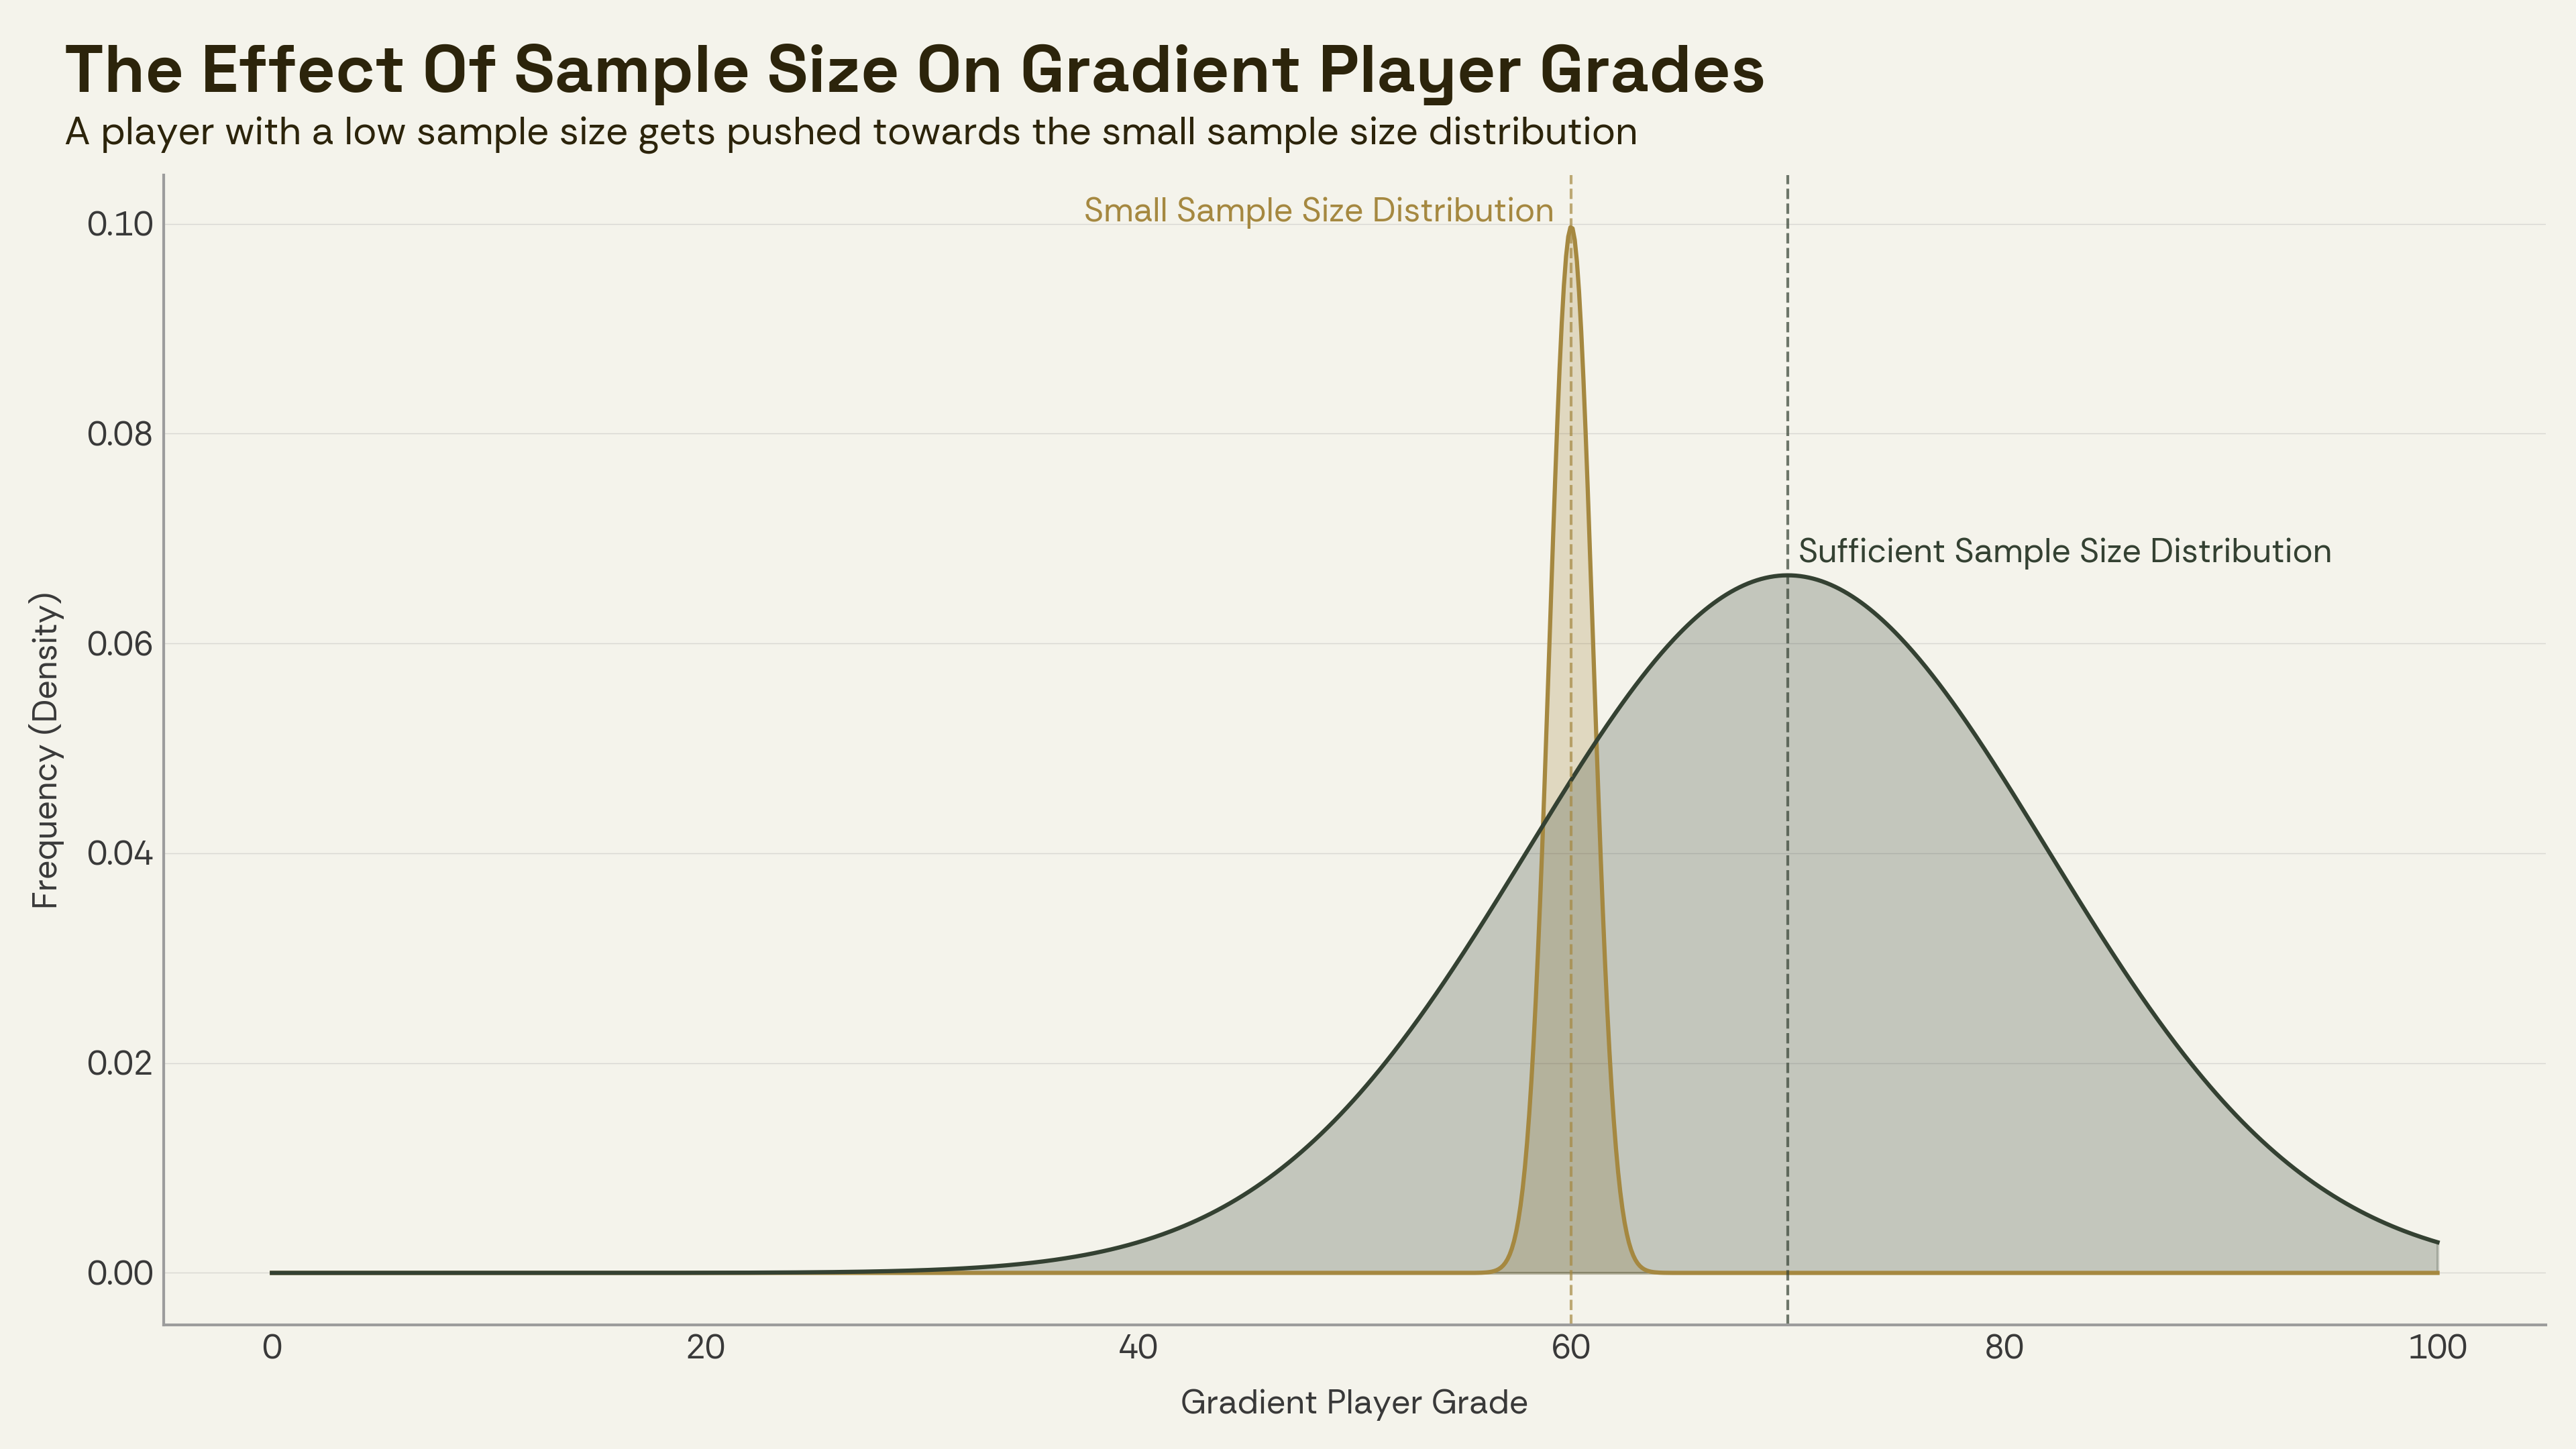
That scale is designed to do more than simply reflect how well a player performed in a small stretch of actions. It also considers how much evidence is available. A player who produces a standout number from a very limited set of actions may not yet provide the same level of confidence as a player delivering a similar level of performance over a much larger body of work. As more actions are observed, the rating becomes a more stable and reliable reflection of true performance.
This helps ensure that the 0 to 100 scale rewards sustained quality rather than short bursts that may be misleading on their own. It reduces the risk of overreacting to very small samples and gives greater weight to performances that have been demonstrated consistently over time.
As a result, the final grade offers a clearer, more dependable view of player performance across each facet of the game, making it easier for users to compare players, identify trends, and draw stronger conclusions with confidence.
Up to this point, we have considered each facet of play individually (e.g., passing, dribbling, 50/50 duels). However, there is valuable insight in combining multiple facets into a Composite Grade. For example, our 1v1 Defending Grade includes Tackling, Dribble Defending, and Carry Defending.
Composite Grades are calculated similarly to individual facet grades, but with two additional considerations:
Finally, we calculate a weighted average of the relative volumes across the facets. This produces the overall relative volume and composite-adjusted grade, which is then converted to the 0–100 scale.
Overall Grade is a Composite Grade that includes all facets. It is calculated the same way as composite Grades with one key difference being the addition of positional weighting on top of the normalisation and facet weights described in the previous section.
Positional weights reflect how important each facet is for a specific position. For example, shooting carries more weight for centre-forwards than for centre-backs. These weights are determined by analysing which facets are performed more frequently by each position relative to the others.
It’s also important to note that we have a separate Goalkeeper Overall Grade to handle the uniqueness of this position. This is calculated as a Composite Grade of this Overall Grade and the Shot Stopping Grade.
Our next article will dive into Overall Grades in much more detail, so stay tuned for that!
Whether the goal is to identify stronger signals in the transfer market, tell more compelling player stories, or uncover insights traditional data cannot surface, Gradient can help. Teams, media organizations, and agencies looking to see how Player Grades can support their work can schedule a demo with Gradient’s sales team today.