June 25, 2026
Gradient FC’s Player Rankings: Explained
Player Rankings


The most impactful moments in modern football often happen away from the ball: a forward's run in behind the defensive line, a fullback sprinting past a winger on the overlap, or a midfielder making a late run into the box. These movements shape the structure of attacks, pull defenders out of position, opening up space that leads to the opportunity to create changes. Using Gradient's unique combination of broadcast tracking and event data, we are now able to detect, classify and aggregate forward off-ball movement for every player in every game we cover. This post explains how it works.
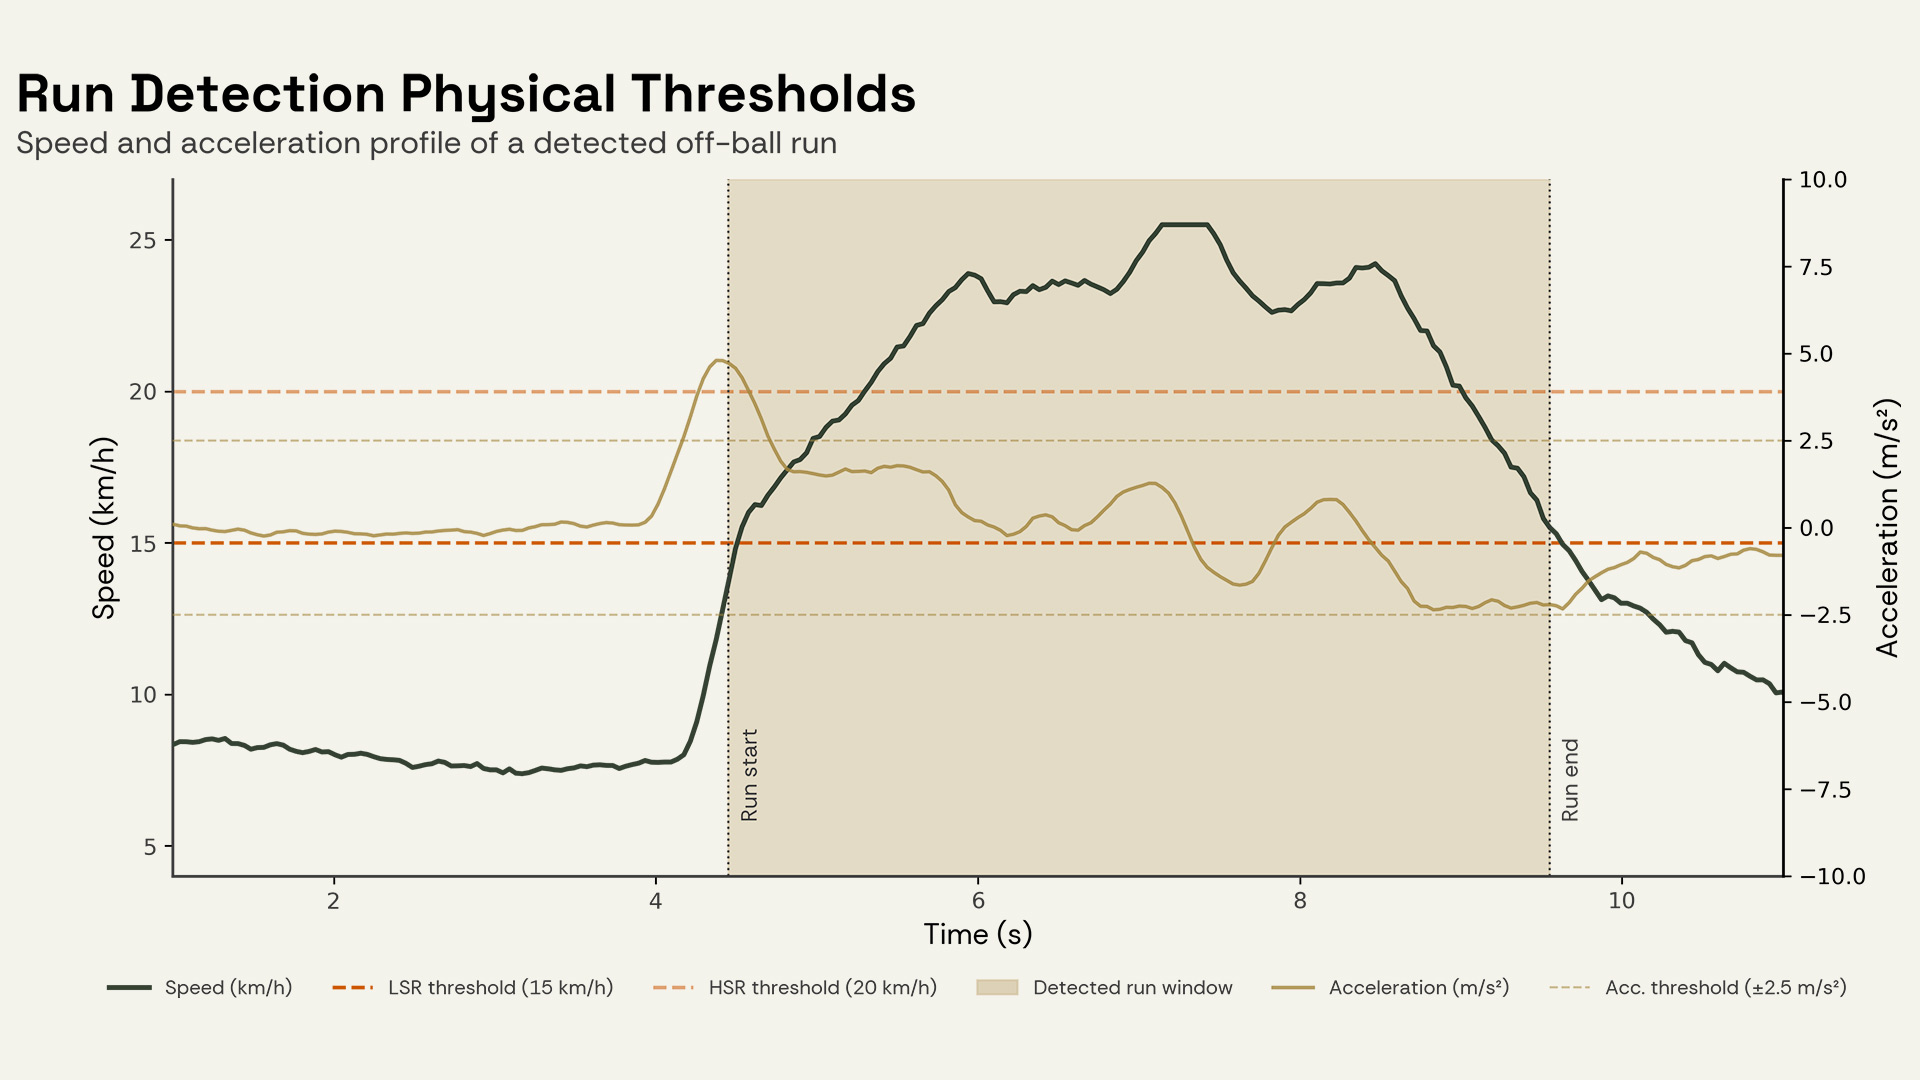
A run begins when one of two conditions are met: the player exceeds 15 km/h while accelerating at 2.5 m/s² or more, or the player exceeds 20 km/h regardless of acceleration (pure high-speed running). A run ends when any of the following occur: either the speed drops below 15 km/h, a sharp deceleration while below 20 km/h happens, the runner receives the ball, or possession is lost by their team. Back-to-back runs separated by less than 0.5 seconds are merged into a single run; unless the previous run ended on a hard stop such as ball receipt, possession loss, or a stoppage. This prevents fragmented runs from being counted multiple times.
Broadcast tracking introduces noise that dedicated optical tracking does not. Players briefly disappear behind other players, occlusions create short gaps in position data, and estimated positions are interpolated when a player is off-screen. To address this, the visibility percentage is calculated for each run: the share of frames during the run in which the player was positively identified rather than estimated. Only runs where this exceeds 99.9% (full visibility) are used in our aggregated metrics, ensuring that the data driving leaderboards and comparisons comes from high-confidence tracking.
Once a run is detected, we divide it into 15 equally spaced control points from start to finish. At each control point we record the player's position, the position of the ball (when a teammate is in possession), and a range of contextual features: which zone the player occupies, how many teammates are ahead or behind, whether the player is in the box, and the runner's speed at that moment.
The 15-control-point structure serves two purposes. First, it normalises runs of very different durations into a comparable format; a three-second sprint and a seven-second run are both described by the same 15 snapshots. Second, and more importantly, it makes the data re-usable. Every club has its own vocabulary for run types. What one analyst calls an overlap, another might define differently. By providing the full 15-point spatial profile of each run, clubs can apply their own classification rules on top of our data without needing to reprocess tracking from scratch. Our run type classification is only a starting point for analysis, not a constraint.
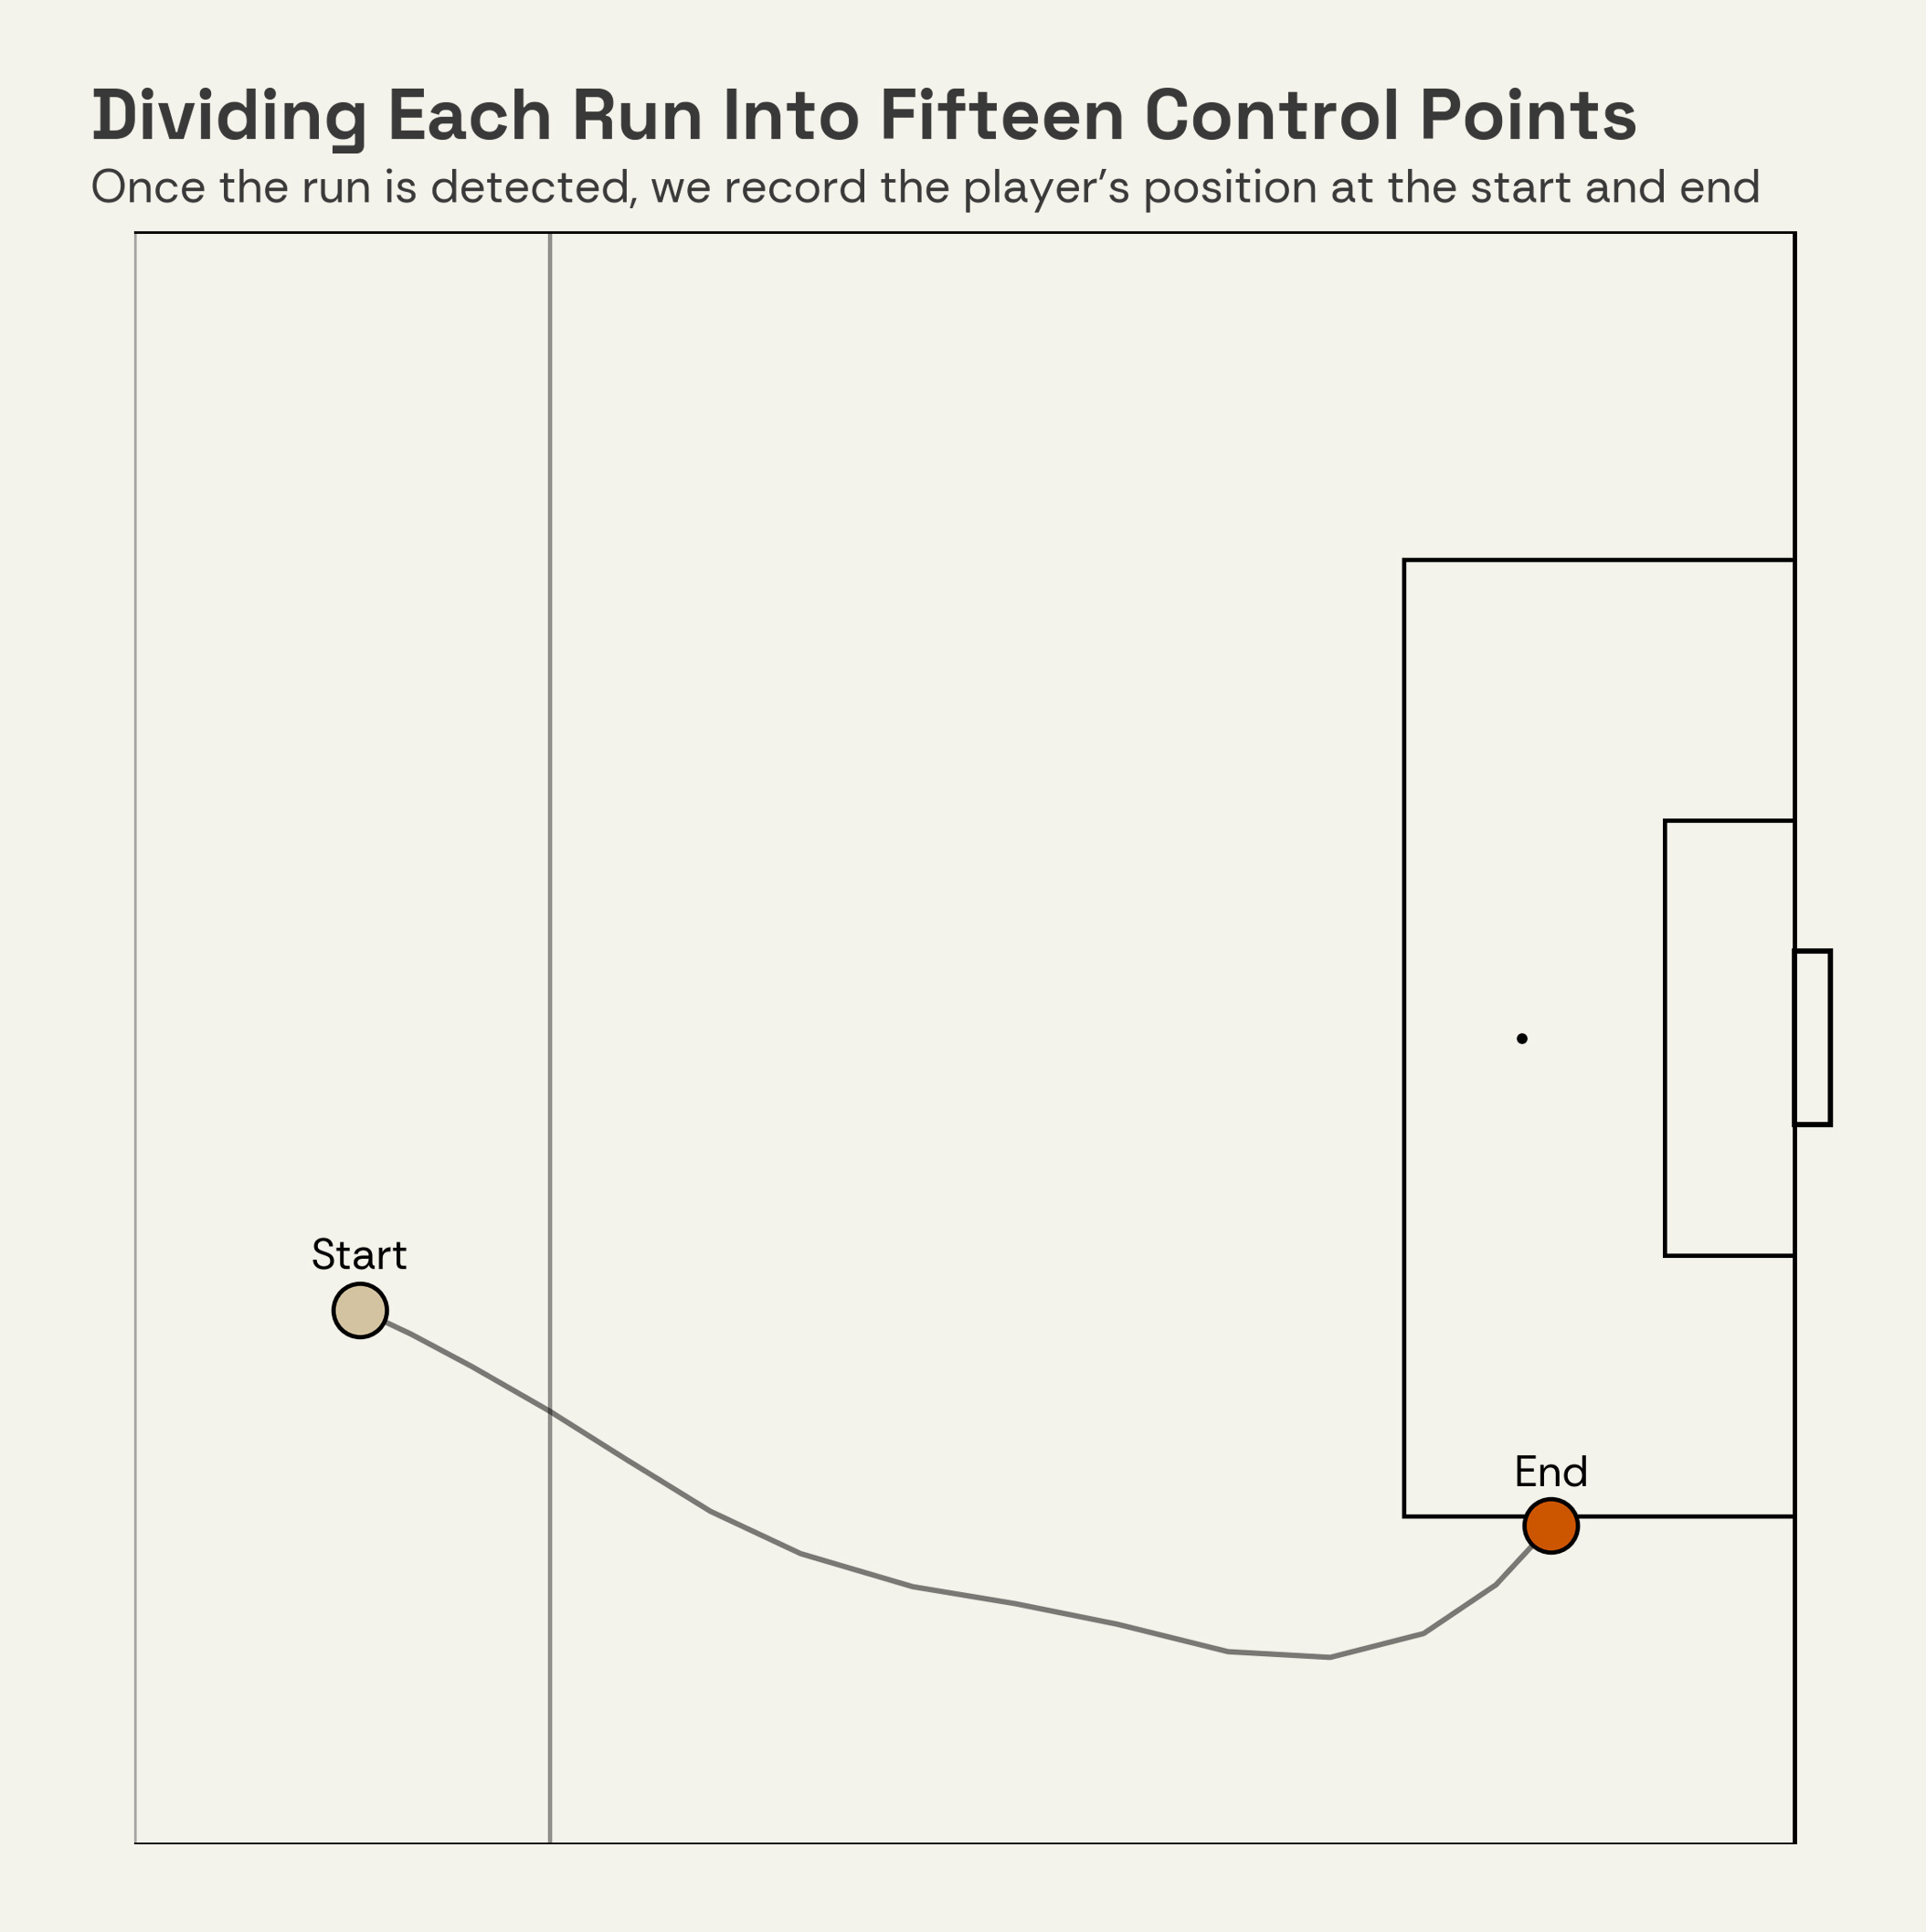
Once the run is detected, we record the player's position at the start and end
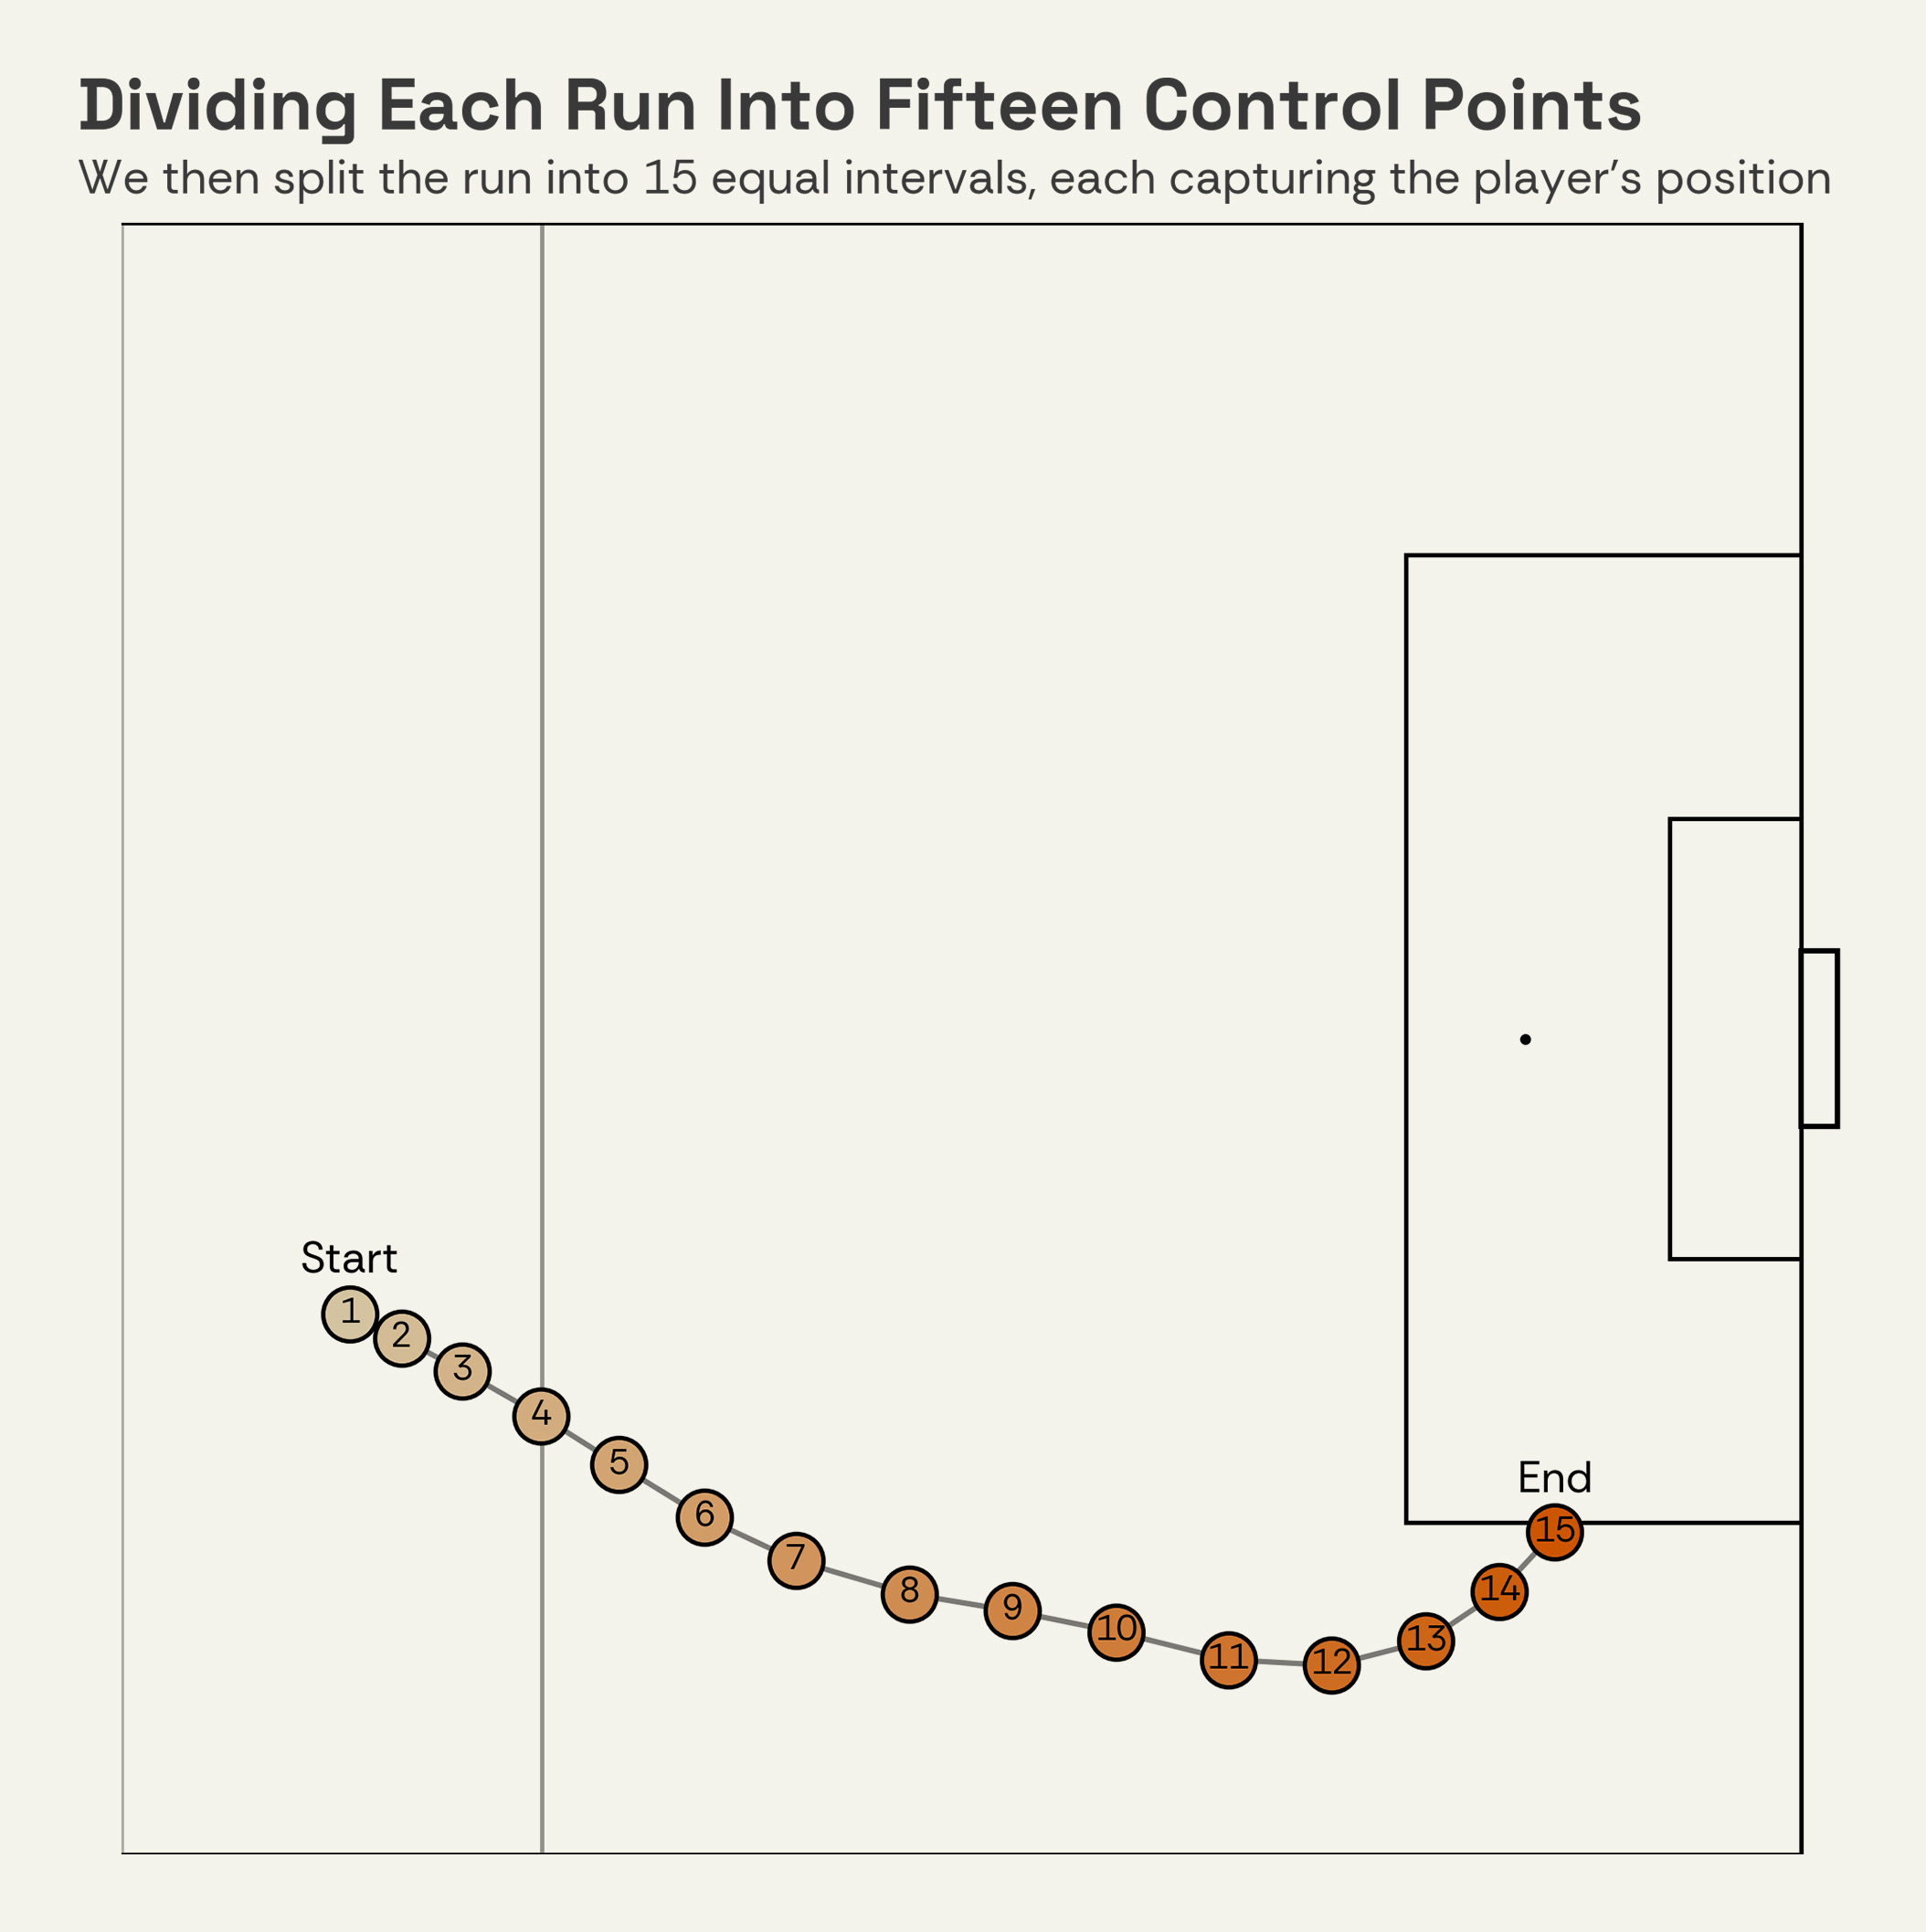
We then split the run into 15 equal intervals, each capturing the player's position
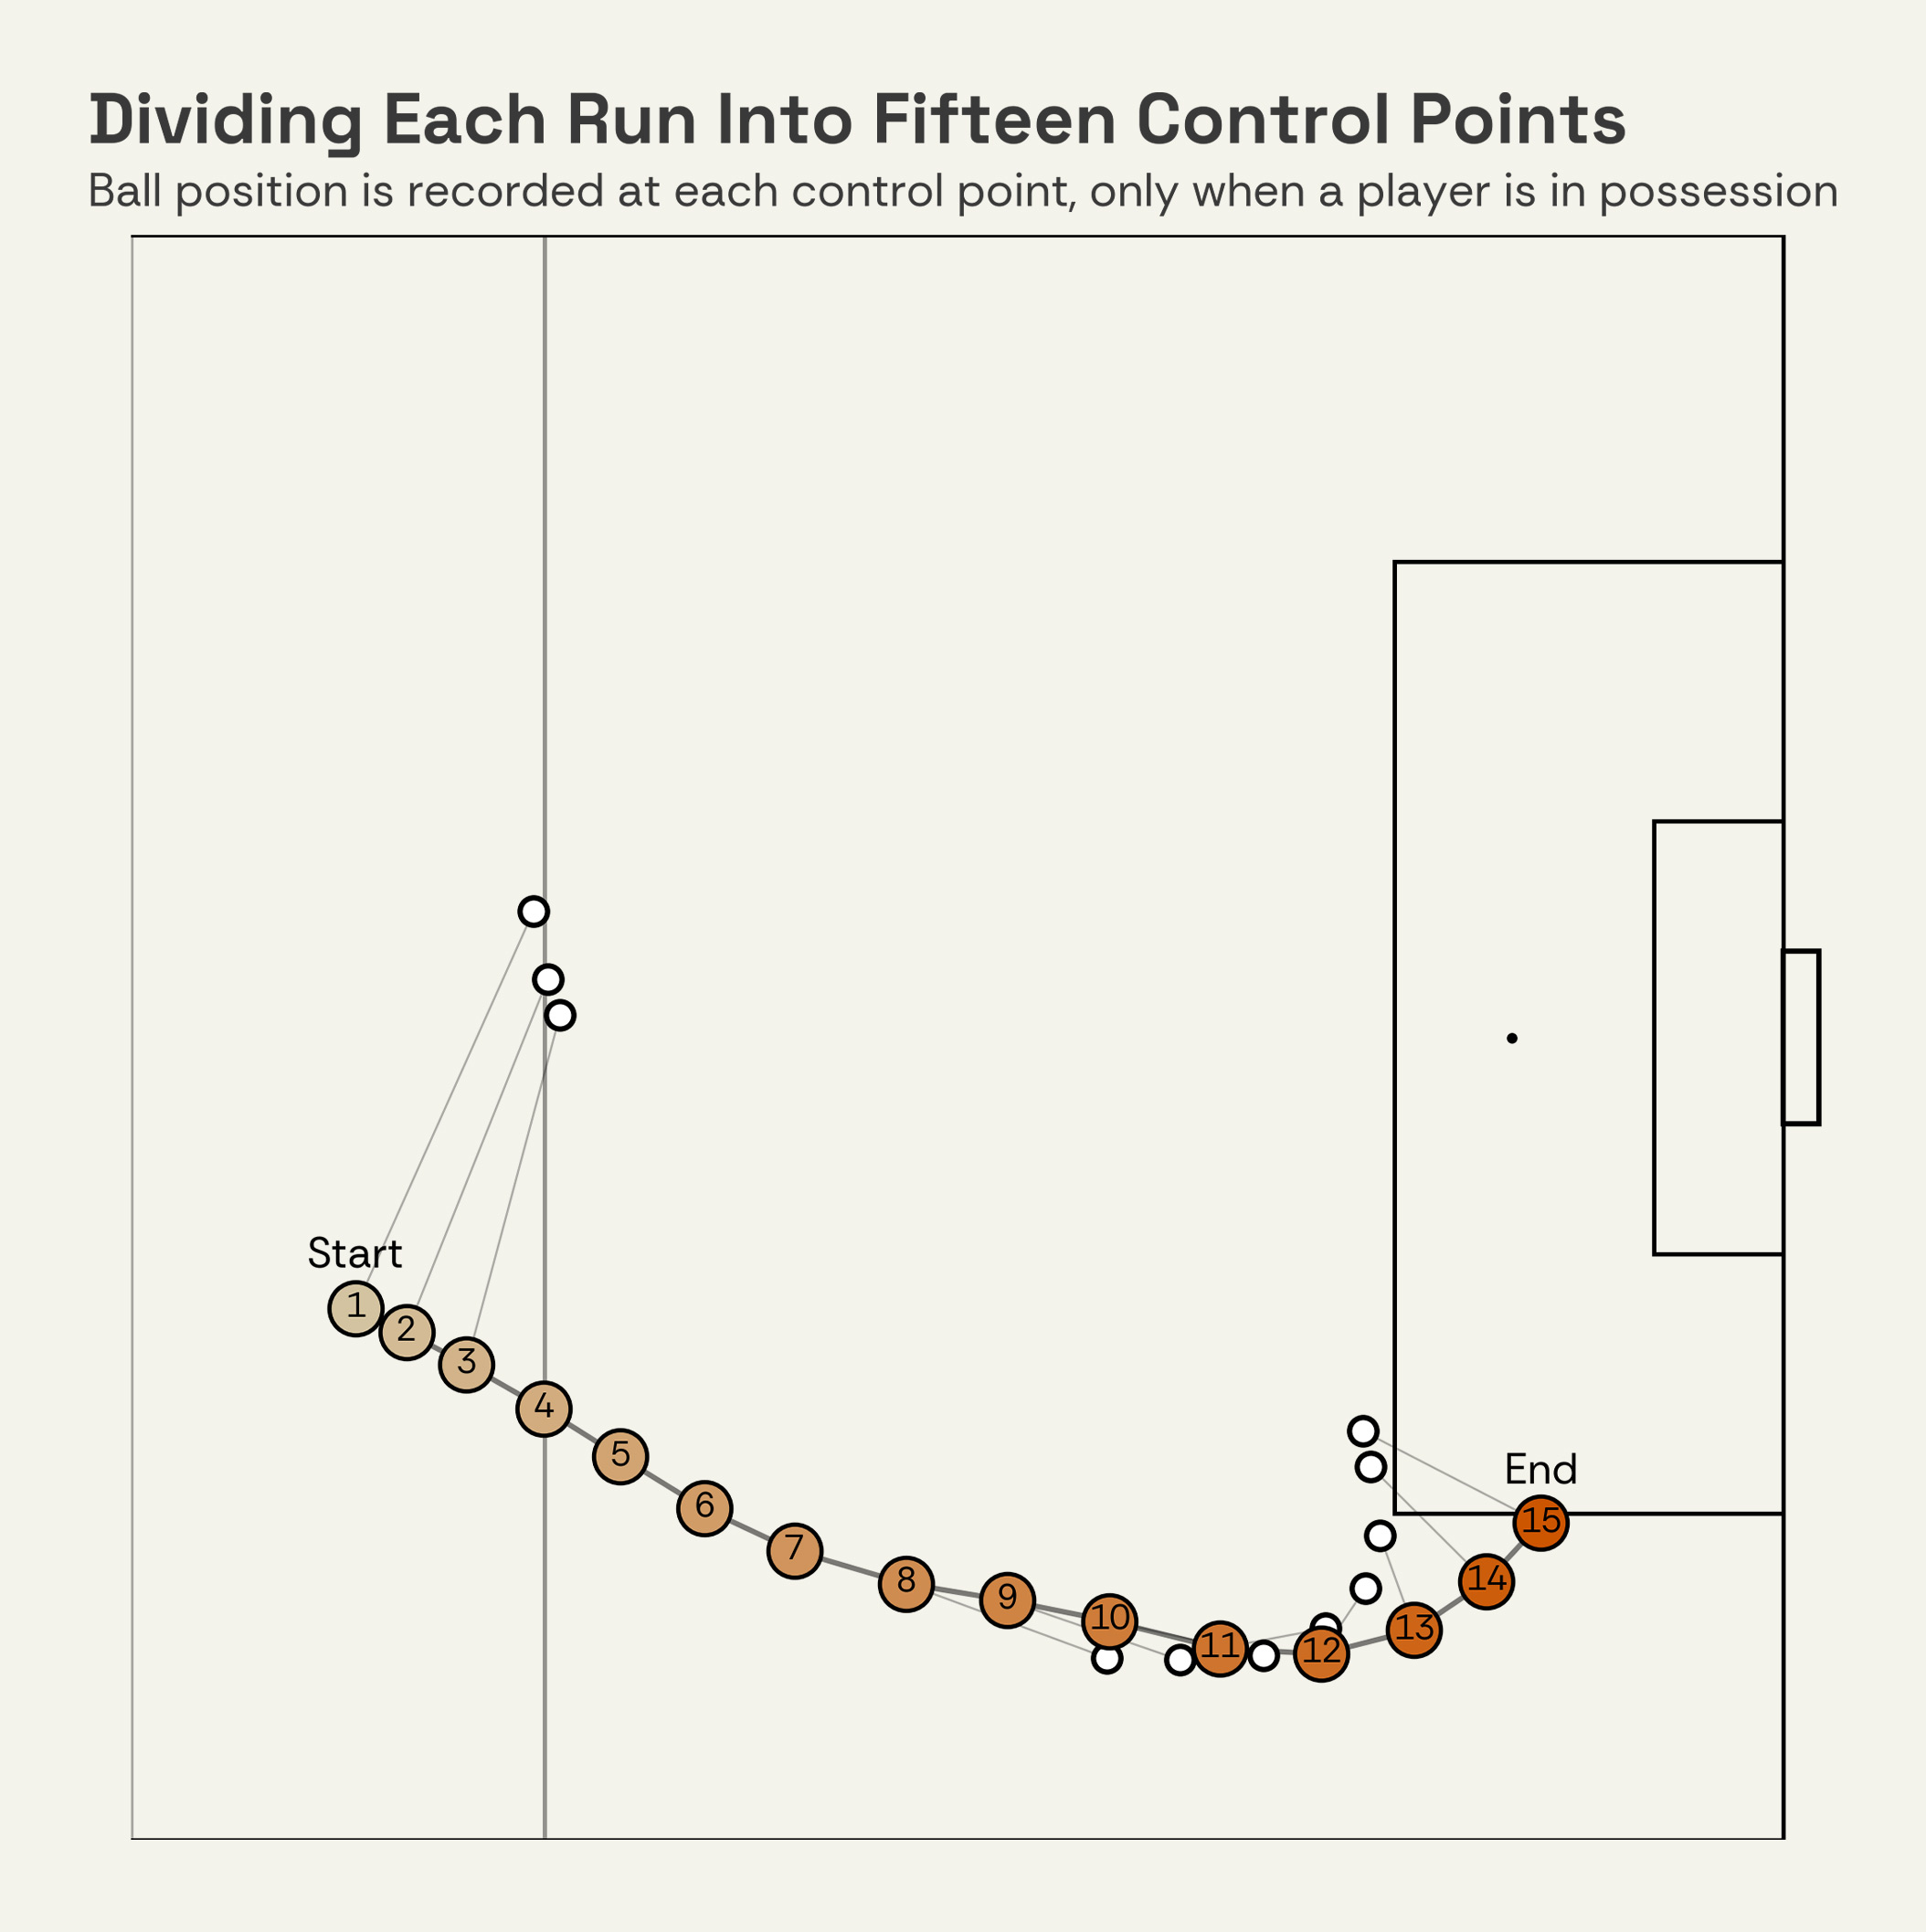
Ball position is recorded at each control point, only when a player is in possession
All detected runs are first filtered to forward direction runs where the player moves toward the opponent goal. Within forward runs, we apply a hierarchical classification that assigns each run to exactly one type.
Overlaps
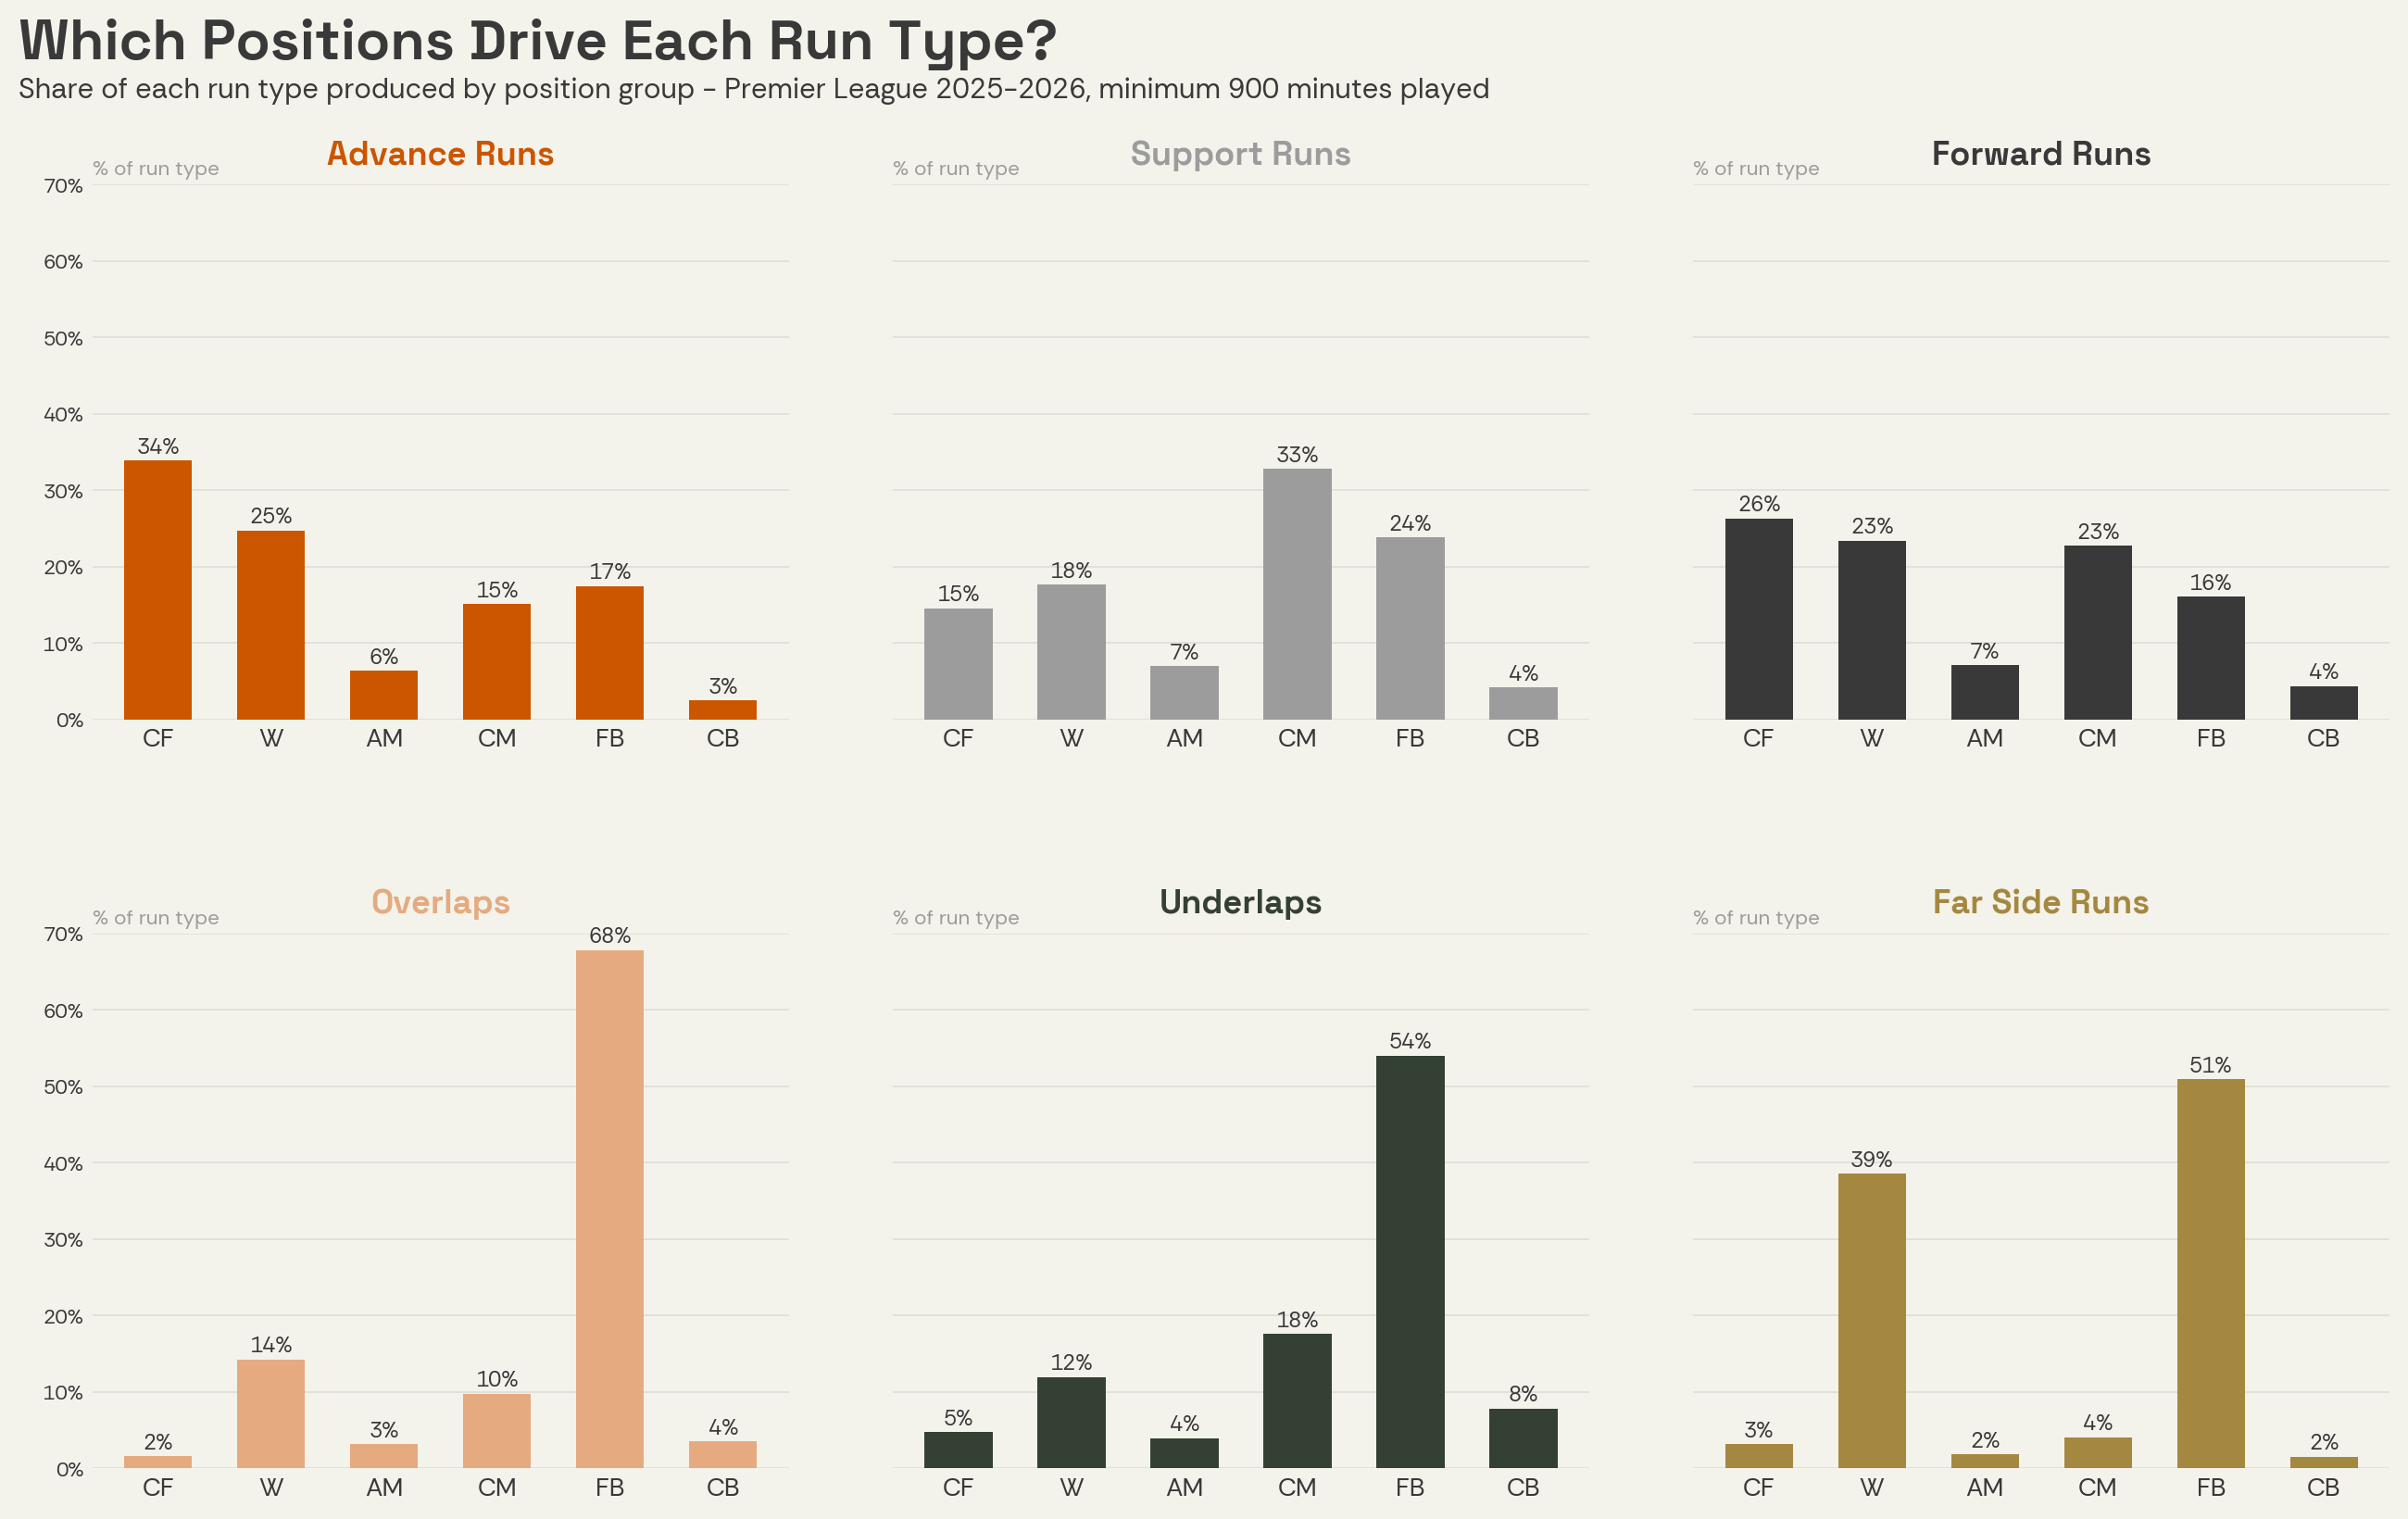
The runner overtakes the ball carrier on the outside, lapping at a point in the outer wing, inner wing, or outer halfspace. The ball is not in the centre zone at the lapping point, and no teammates are further outside than the runner. These are the archetypal fullback runs and the data confirms it, with 68% of all Premier League overlaps produced by fullbacks and wing backs.
Underlaps
The mirror image of the overlap: the runner overtakes the ball carrier on the inside. The same lapping zone conditions apply, and at most one teammate is outside the runner at the lapping point. Fullbacks account for 54% of all underlaps, with midfielders contributing a further 18%.
Far Side Runs
The runner is on the opposite side of the pitch from the ball for a significant portion of the run. Far side runs split between fullbacks (51%) and wingers (39%); exactly the players whose starting positions put them on the weak side of the pitch when play is switched to the opposite flank.
Advance Runs
The player runs forward and remains ahead of the ball for the entire run, or finishes ahead having never fallen behind. These are the forward’s bread and butter: 34% of all advance runs in the Premier League are produced by centre forwards, with wingers contributing another 25%.
Support Runs
The runner remains behind the ball throughout, offering a passing option in support rather than running beyond. Central midfielders dominate here at 33%, followed by fullbacks at 24%, reflecting the roles of players who maintain positional compactness and provide short recycling options.
Forward Runs
Forward runs that do not meet the criteria for advance, support, far side, overlap, or underlap. These are typically transitional in nature; runs that cross the ball’s position at some point, moving from behind to ahead and usually occupy a neutral corridor relative to play.
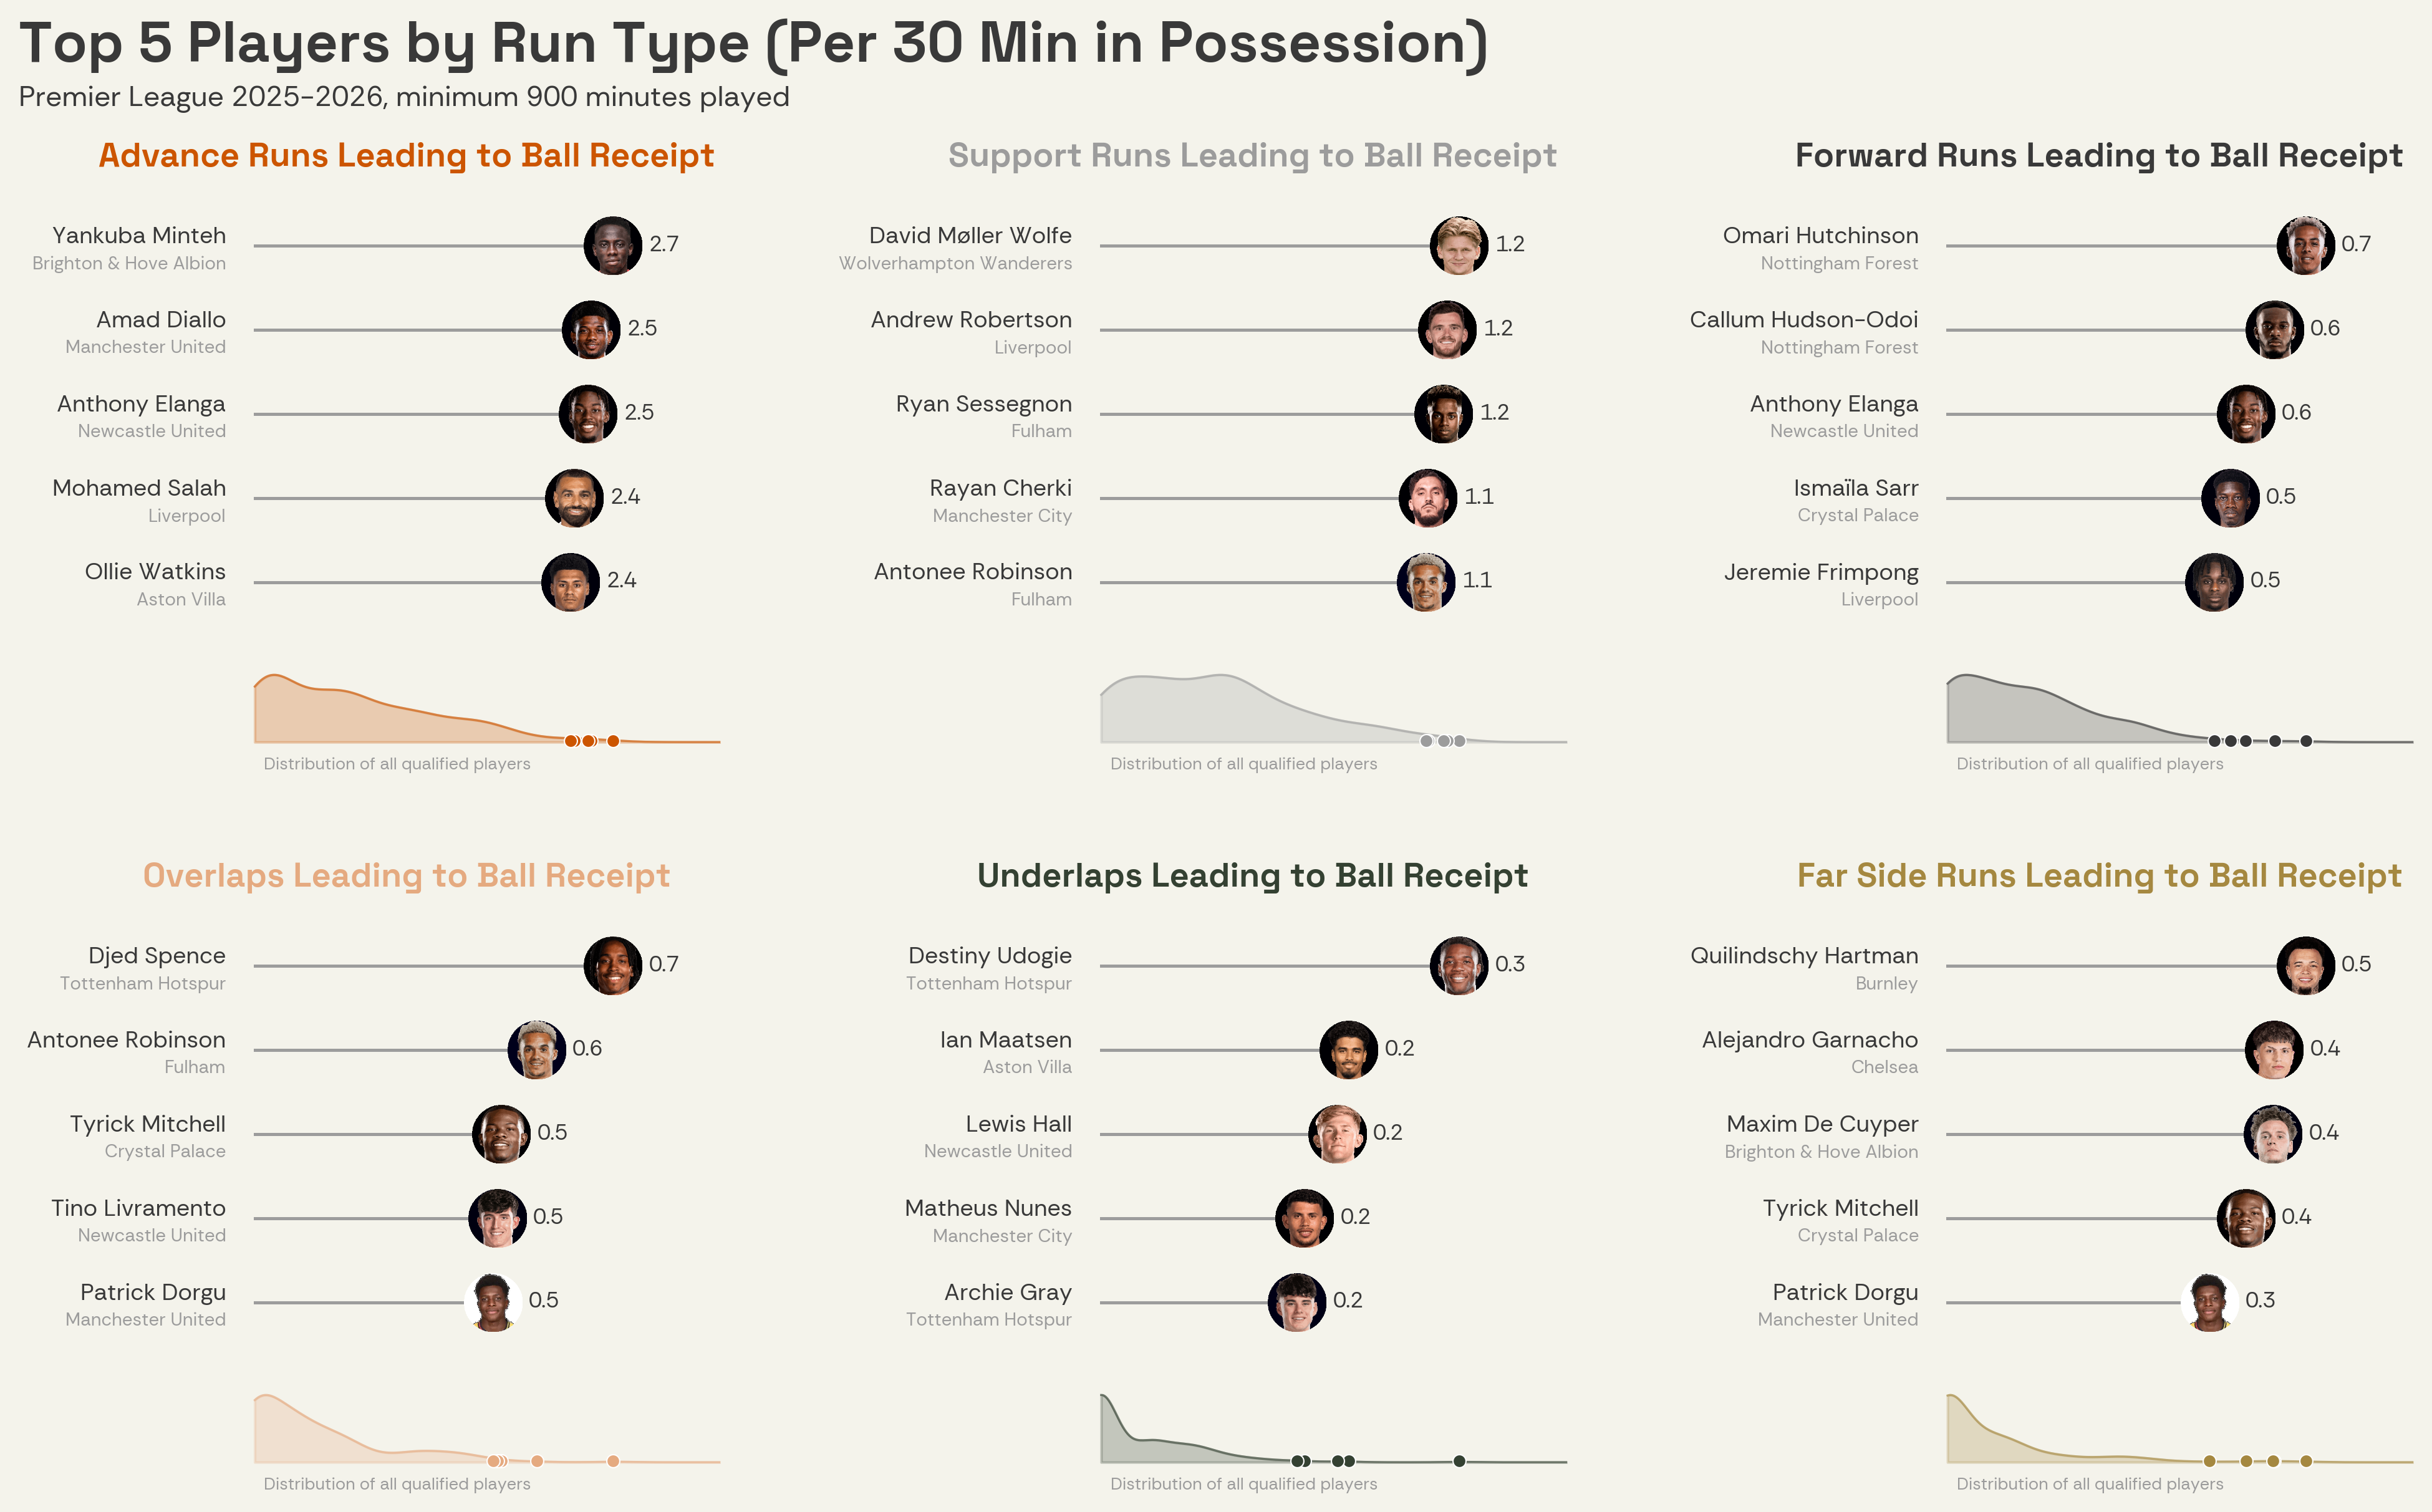
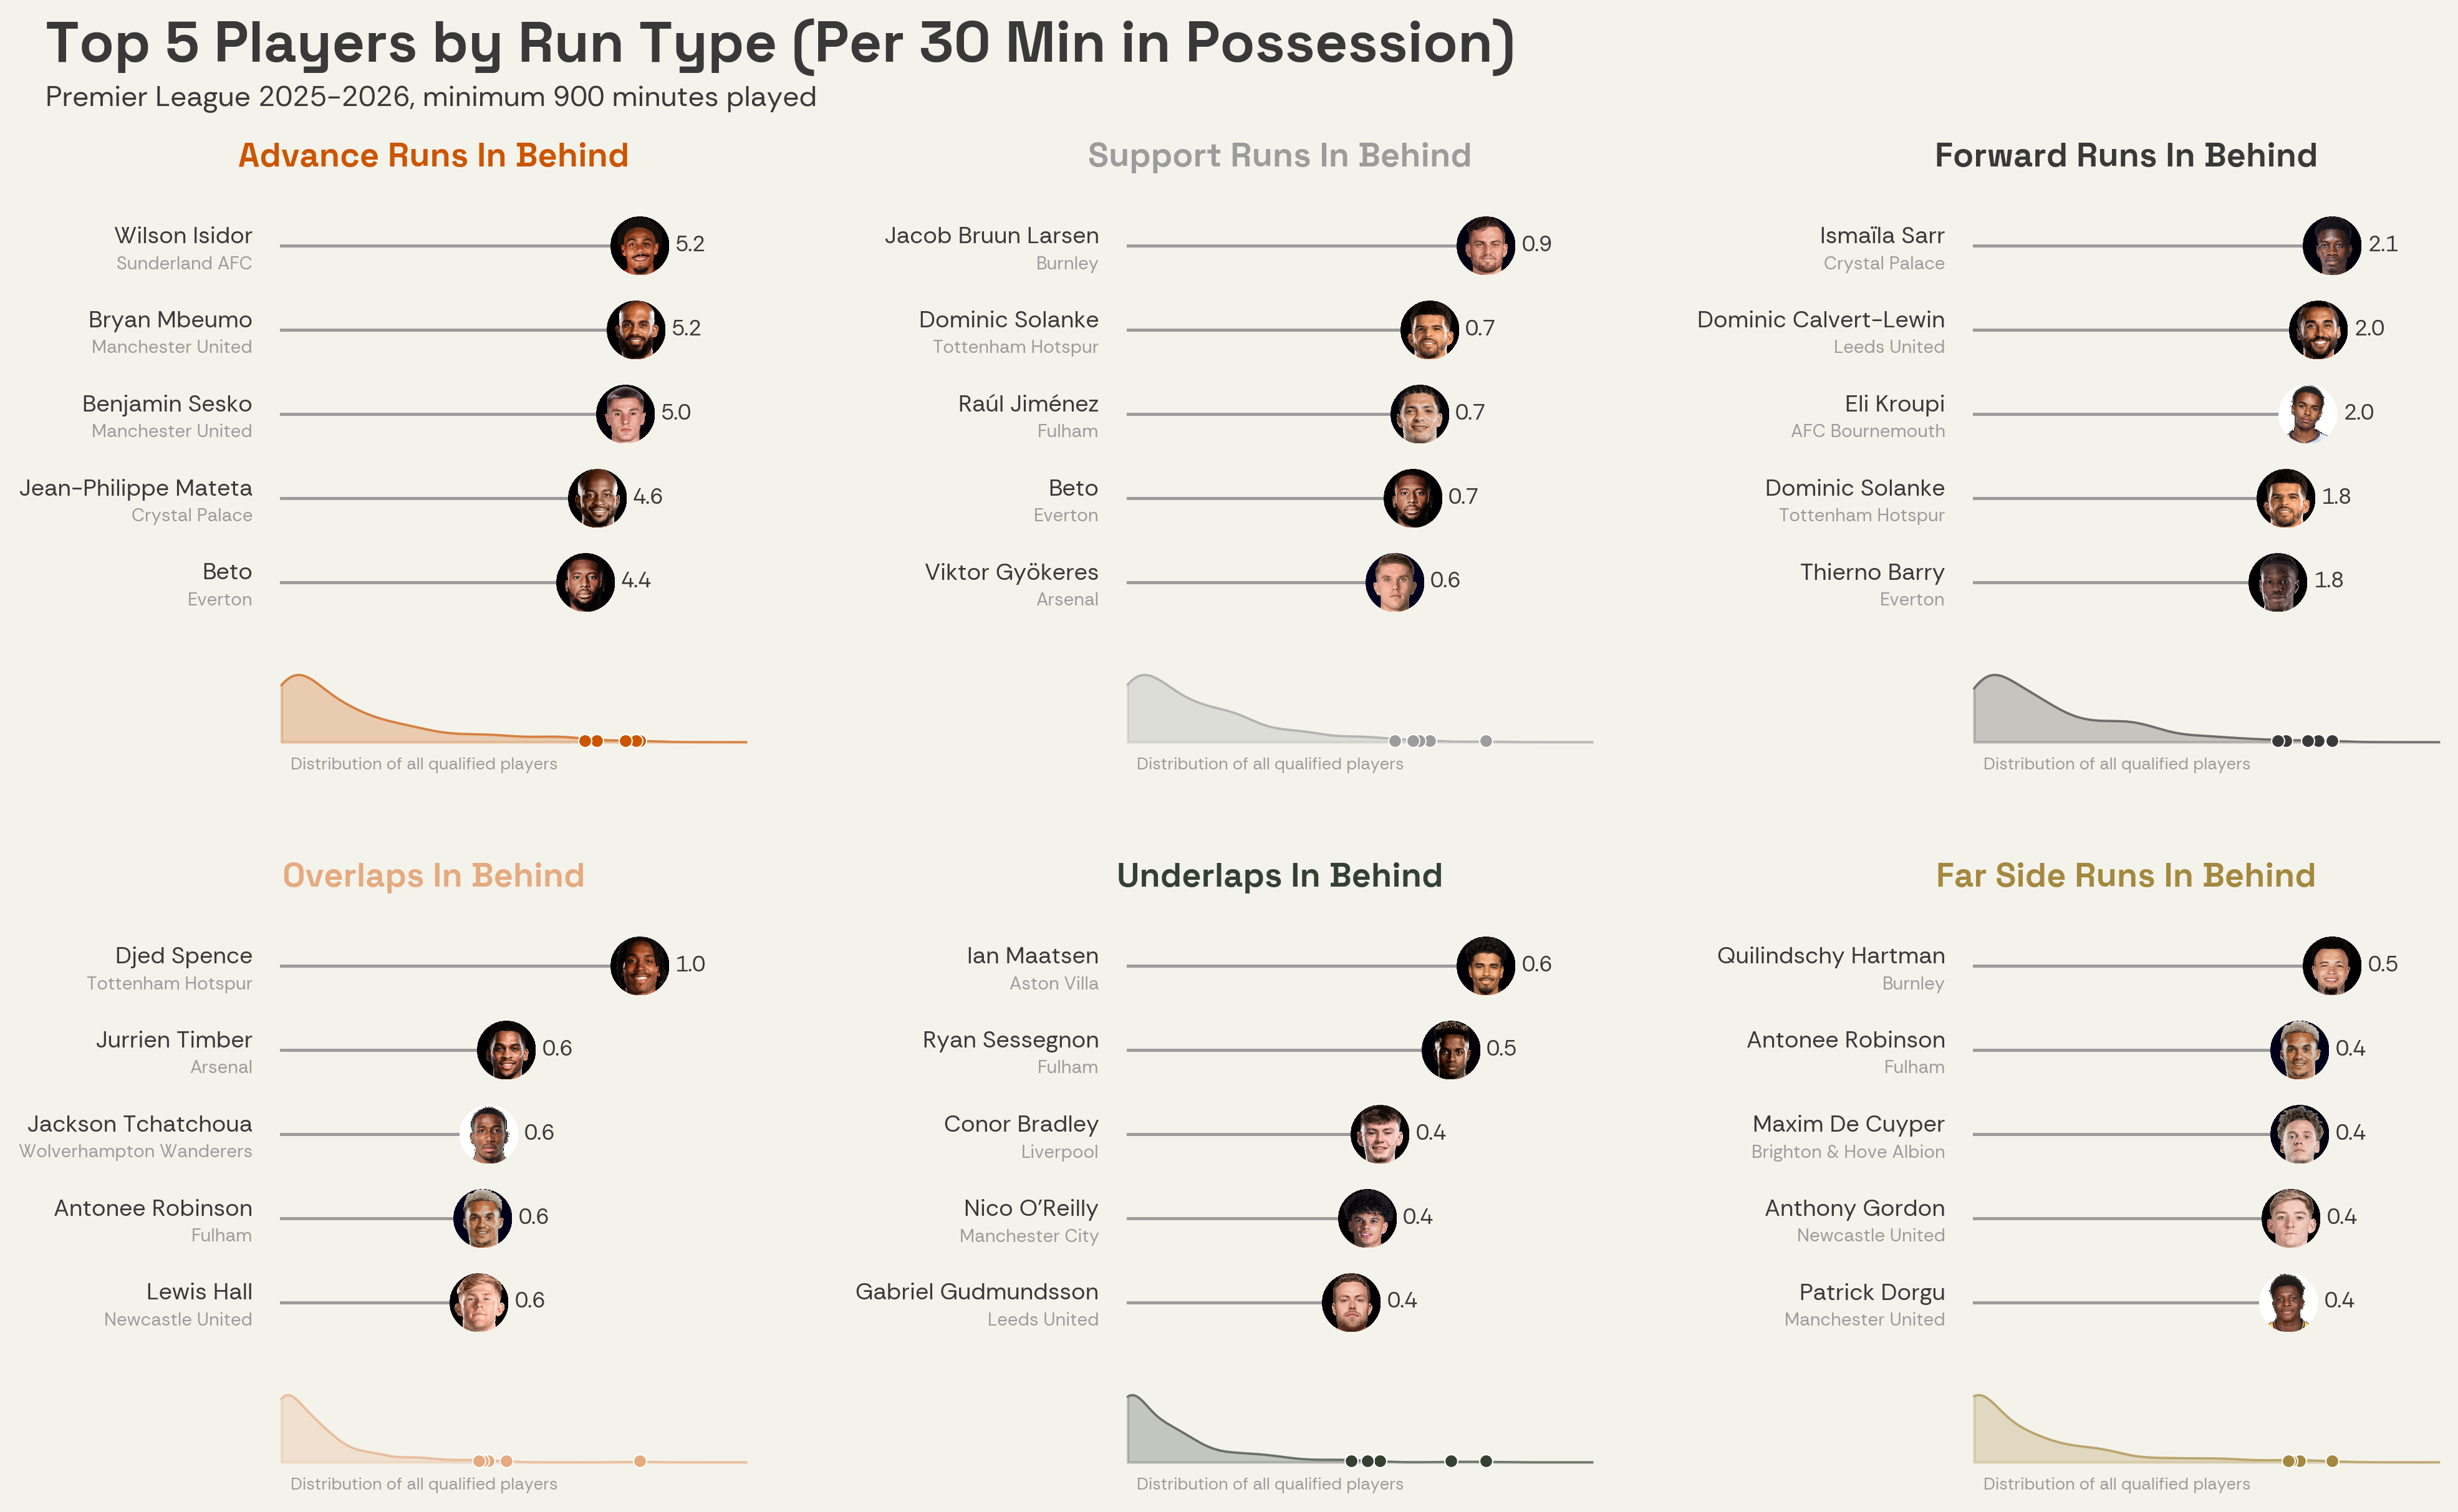
Run type classification tells you how a player ran. A second layer of modifiers tells you where they ended up and how they got there. These are independent of run type and stack on top of any classification. For example, we flag runs where the runner ends beyond the opponent's defensive line: a fullback making an overlap that ends behind the last defender is an overlap in behind, a striker's advance run that breaks the offside trap is an advance run in behind, and so on. Other modifiers flag runs into the box, into the final third, runs by distance band (short under 12m, medium 12–24m, long over 24m), and fast runs above 25 km/h average speed. We also flag runs where the runner received the ball within one second of the run ending. All modifiers combine freely, and because the full 15 control points are always provided, clubs can define or redefine any of them using their own thresholds.
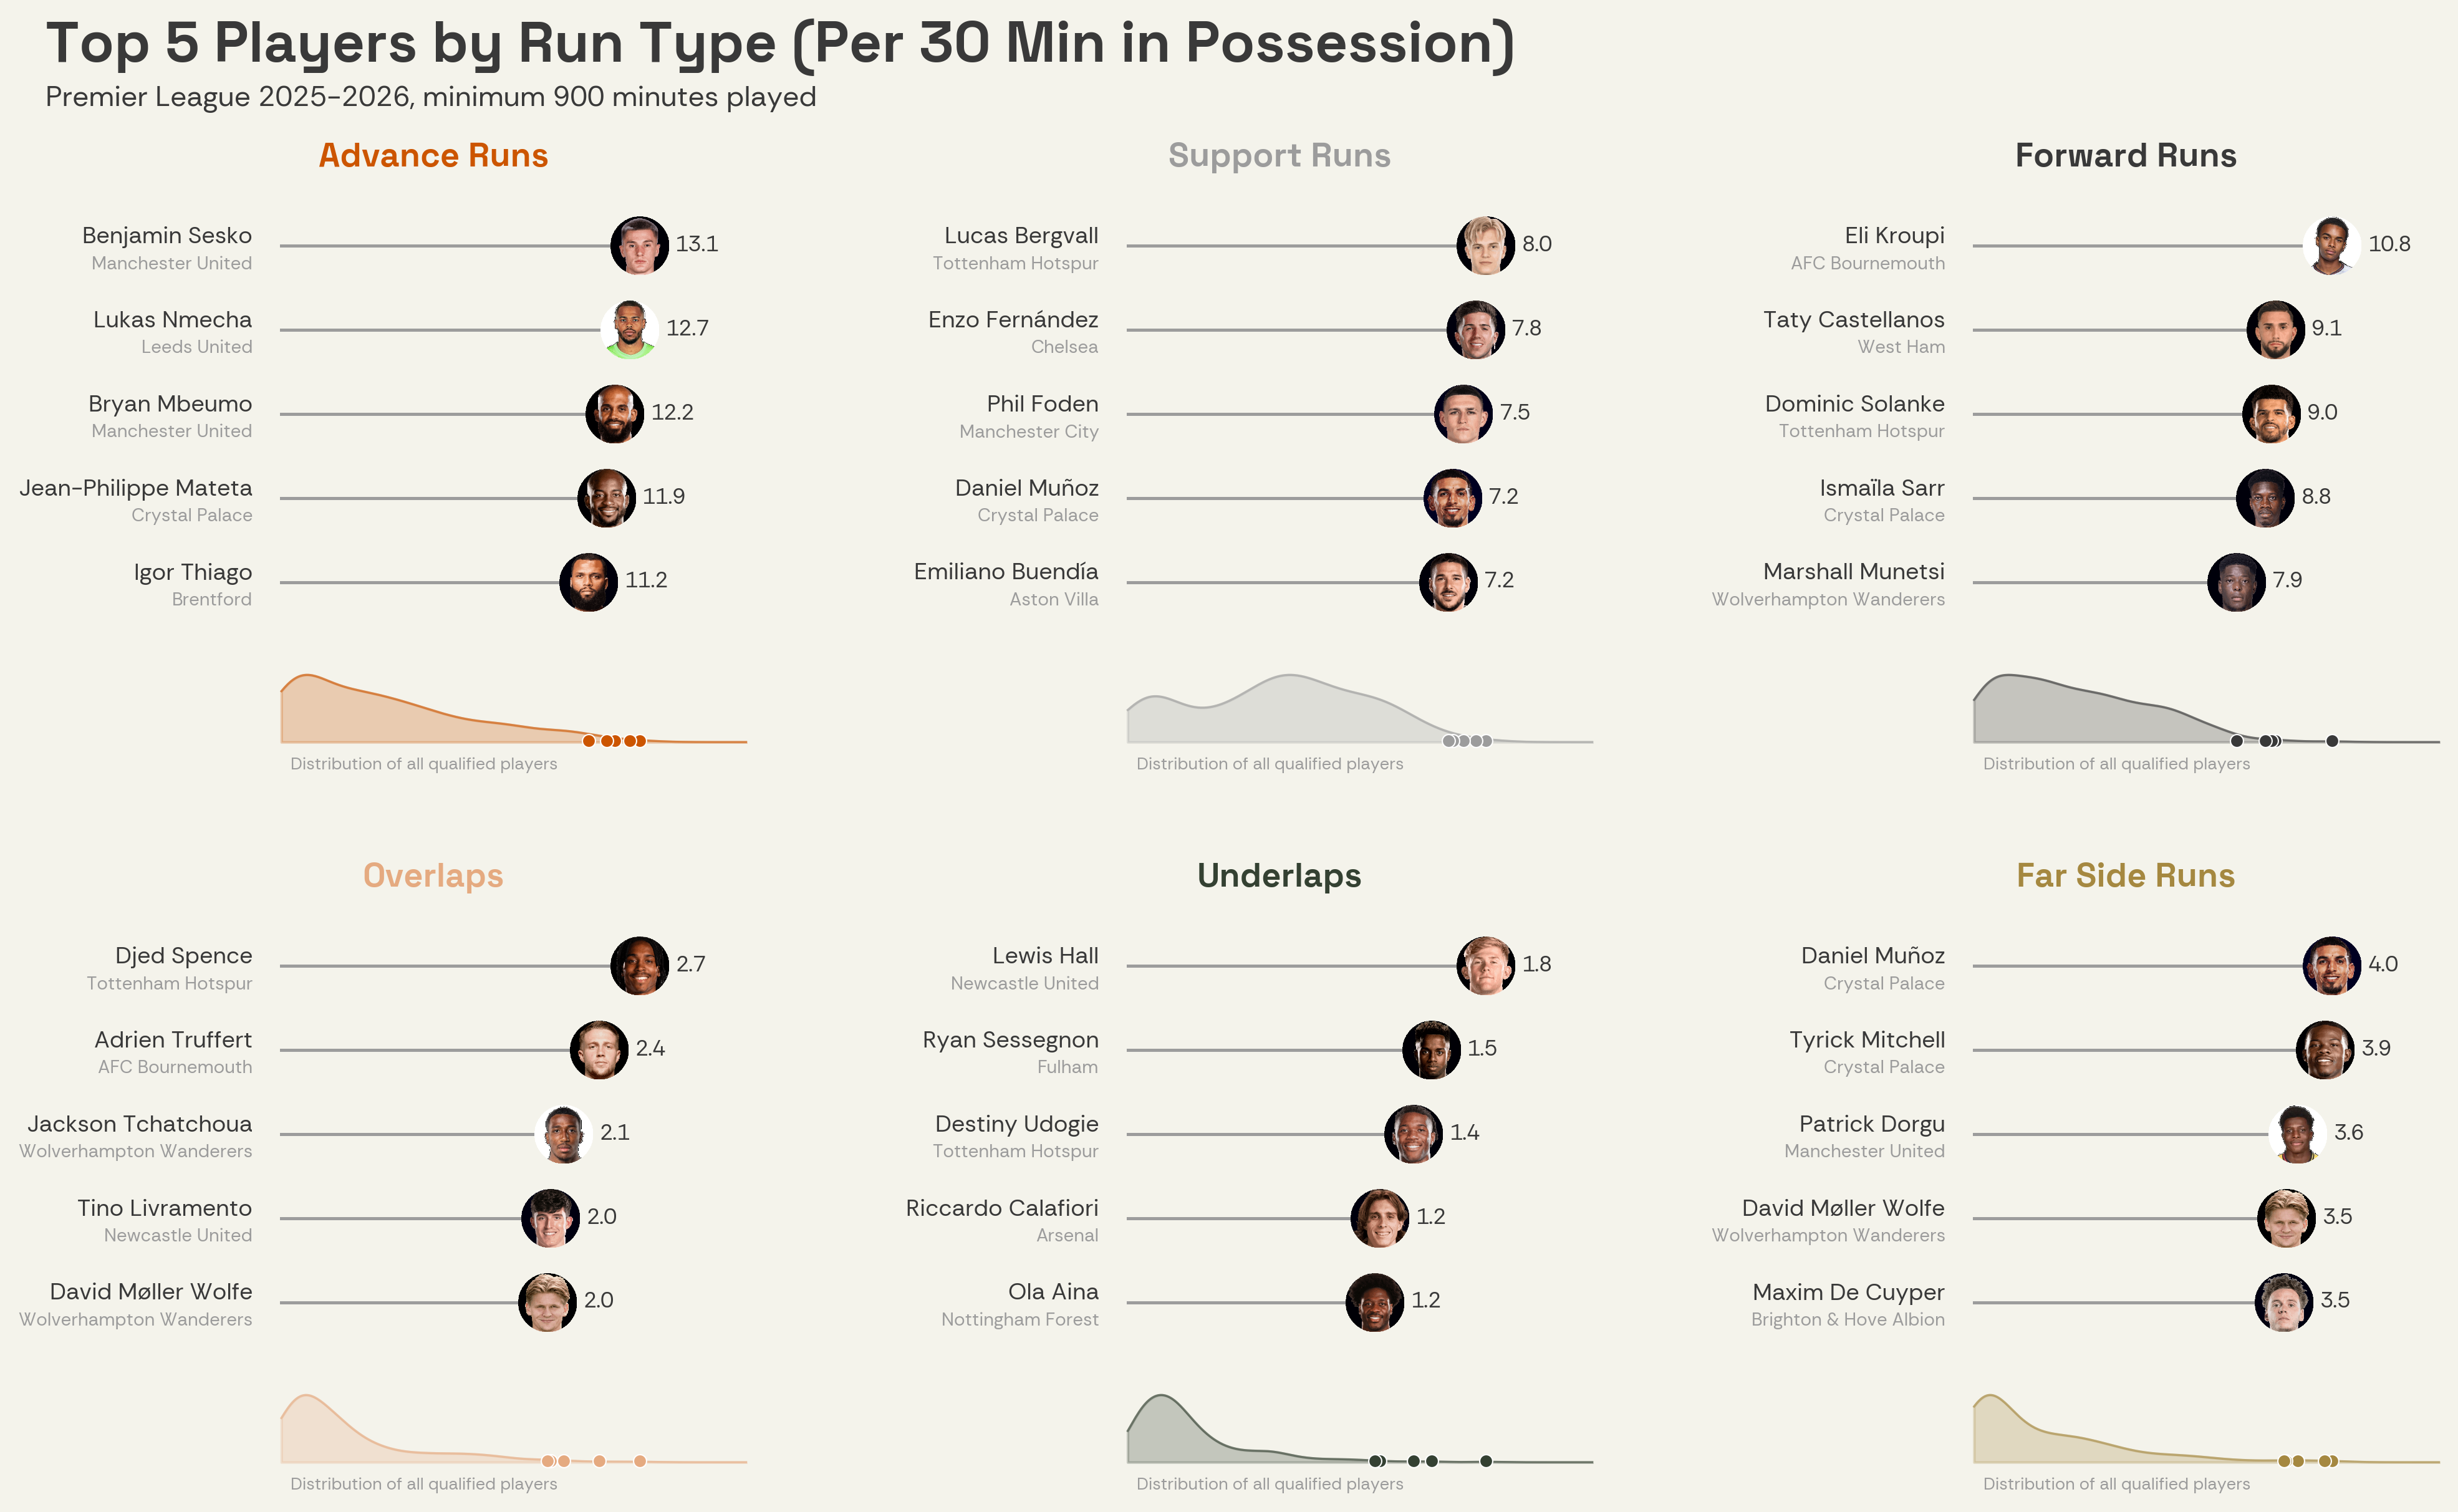
This season’s leaderboards for the Premier League surface a few insights worth flagging. Note that we are filtering to players with at least 900 total minutes played, and look at each run type per 30 minutes in possession. Djed Spence tops each overlap category here, with his total volume (2.7 per 30), overlaps ending in behind (1.0), and overlaps leading to a ball receipt (0.7). This level of single-category dominance is not matched by any player for the other run types. Crystal Palace's attacking pattern surfaces clearly too, with Daniel Muñoz, Tyrick Mitchell, Jean-Philippe Mateta, and Ismaïla Sarr all featuring across several run types. It shows that off ball movement numbers cannot be analysed without taking team playing style into consideration. These leaderboards are a starting point rather than a destination. Because the underlying data exposes the full 15-control-point spatial profile of every run, any club can apply its own definitions, thresholds, and tactical questions on top.
If you work for a team, agency or media company and would be interested in learning more about our off-ball run offerings, please get in touch, at sales@gradientsports.com