
July 15, 2026
Servette FC Partners With Gradient to Enhance Performance Analysis
Partnerships


Passes are the most frequent event in football, far more common than shots, tackles, or crosses. As a result, they have played a central role in football analysis, often captured through counting stats (such as total passes or completion rate), possession metrics, or loosely spatial measures like passes into the final third.
To move beyond these broad aggregations, recent work has turned to clustering, a machine learning technique that groups passes based on their spatial characteristics, such as start and end locations, length, and direction. This then allows for further analysis into the characteristics of these passing patterns such as if they are mostly ground balls or aerial passes, or if they are long or short passes. For example a cluster that mostly includes passes between two central defenders would mostly consist of short, ground passes whereas a cluster that includes switch of plays would reflect long and aerial ball characteristics.
While clustering has become a valuable tool for descriptive purposes, it does not reflect execution quality. At Gradient Sports, we aim to go further. By combining clustering with our renowned player grading system, we can move past solely descriptive findings and begin to understand which types of passes teams consistently execute well. We also plan to incorporate additional context from our data collection, including whether a pass broke an opponent line, created a dangerous opportunity, or was played as a specific type such as a through ball. This added layer allows us to develop a simple, interpretable heuristic for understanding why certain passes in each cluster are considered well executed.
To evaluate which types of passes teams use most, and which they execute most effectively, we first needed to build our own clustering model.
We began by filtering the dataset to include only completed open play passes. Incomplete passes were excluded, as their intended targets or end points are often unclear. For example, it is difficult to assess where exactly a blocked or intercepted pass would have been received. For each pass, we extracted three core features from our broadcast tracking data:
• The starting location on the pitch (x and y coordinates)
• The length of the pass
• The angle of the pass, measured relative to the opponent’s goal
To ensure consistency, all passes were normalized so that teams were treated as attacking from left to right. Features were then standardized to ensure they contributed equally during clustering.
Importantly, the clustering process did not incorporate descriptive labels such as pass type, ball height, or body part used. Pass grades were also excluded at this stage, as they are introduced later in the study to assess execution quality. The goal of this step was to group passes by their structural characteristics alone, without introducing bias based on outcomes or context.
We selected the Gaussian Mixture Model (GMM) for clustering. Unlike traditional methods such as K-Means, which assume that clusters are circular and assign each pass to a single group, GMM allows for more flexible, elliptical shapes in the clusters and provides soft assignments. This better reflects how passes naturally vary, similar types of passes may start in different areas or cover slightly different angles but still share the same structure. GMM is better suited to capture those patterns. It also gives us a probability score for each assignment, which we use to filter out low-confidence results.
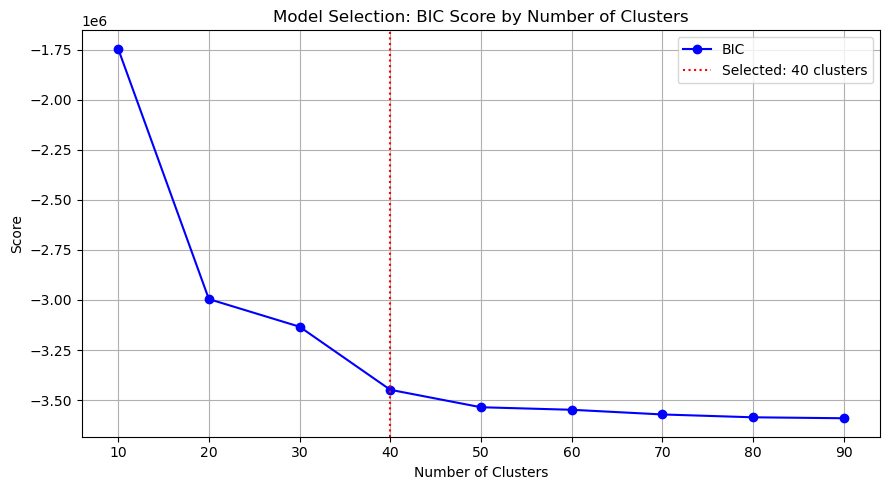
To determine the optimal number of clusters, we trained models with varying values and evaluated them using the Bayesian Information Criterion (BIC). BIC rewards good model fit while penalizing excessive complexity, with lower scores indicating better models. We applied the commonly used elbow method to identify the point at which additional clusters no longer provided meaningful improvements. As shown in Figure 1, BIC scores begin to level off after 40 clusters. Based on this, we selected 40 clusters as the ideal balance between model complexity and interpretability.
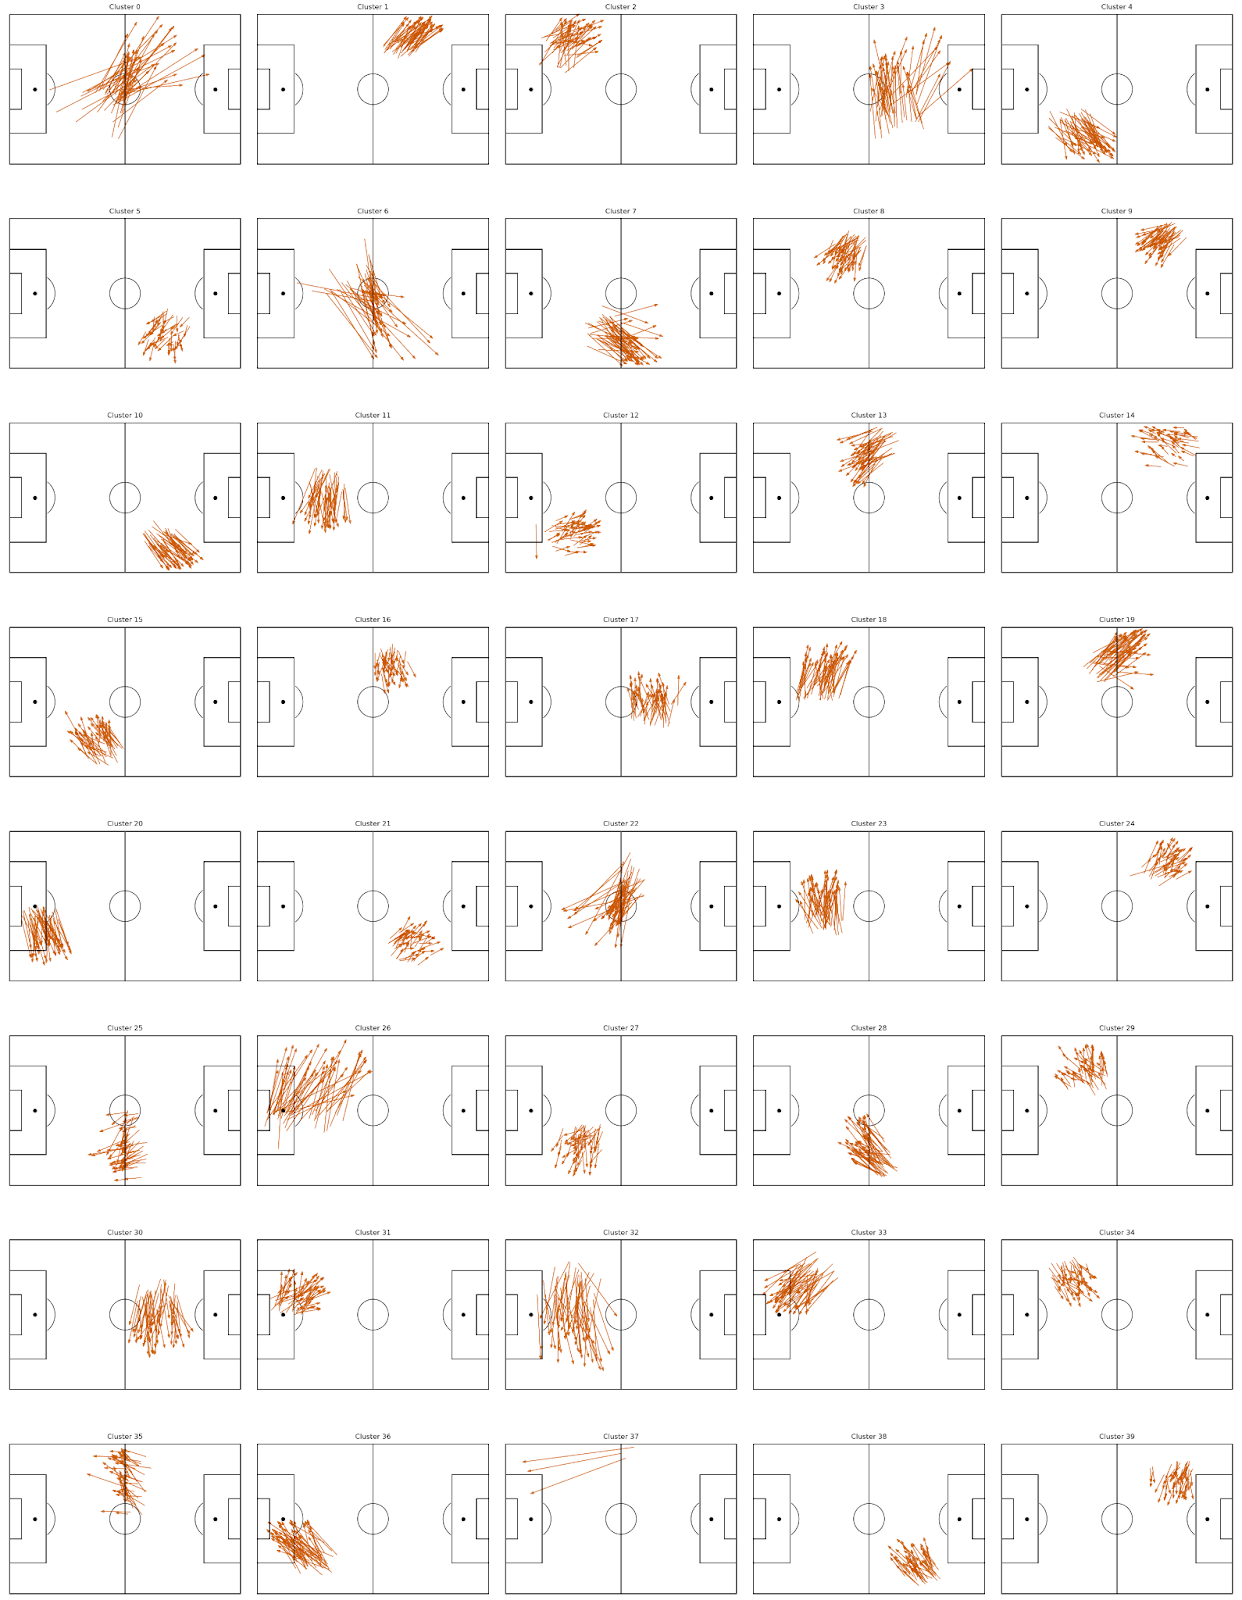
Using the GMM-based clustering process described above, we grouped passes into 40 distinct clusters based on their start location, length, and angle. Figure 2 above shows 50 randomly sampled passes from the 1000 closest passes to the centroid of each cluster.
Some clusters are tightly grouped with clear directional patterns, such as vertical passes or wide switches. Others are more diffuse, capturing pass types that vary more in angle or distance. This variation reflects GMM’s flexibility in shaping clusters to fit the natural distribution of the data. As a result, some clusters are large and capture common pass types, while others are smaller and represent more specific or less frequent patterns.
Having established our 40 pass clusters based solely on spatial structure, we now take the analysis a step further by introducing execution quality. This is made possible by Gradient’s proprietary pass grading system, which evaluates not only whether a pass is completed, but the degree of skill, precision, and difficulty involved. Our grades assign a grade on a -2 to +2 scale in increments of 0.5. A score of 0 represents a routine, expected action, while higher or lower scores capture how much the action exceeded or fell short of expectations. For example, a +1.0 pass might break the defensive line and create a chance, while a -1.0 might be a severely inaccurate ball that leads to a turnover. It is also important to note that the scale is non-linear so a jump from 0.0 to +0.5 is not the same as a jump from +0.5 to a +1.0. For more information on this scale, you can read this explainer.
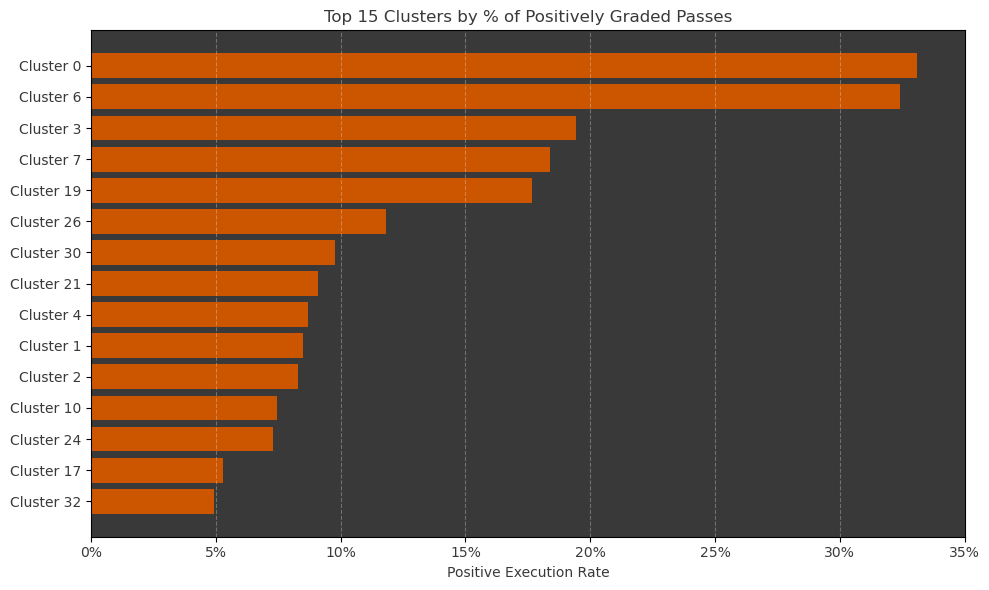
In this step, we calculated the percentage of positively graded passes within each cluster, in other words the percentage of passes executed above expectation. The chart in Figure 3 highlights the 15 clusters with the highest rates of technically impressive execution.
This represents an important evolution in pass analysis. While clustering captures structural patterns, it does not account for how demanding or difficult those passes are to complete. By incorporating Gradient’s grades, which reward passes that require vision, timing, and technical accuracy, we are able to identify clusters that consistently feature high-difficulty and high-skill plays. These are not simply completed passes but actions that challenge defenders, break lines, or hit precise targets under pressure.
Several of the top-ranked clusters reflect this added difficulty. Cluster 0 and 6 include long-range diagonal passes, while Clusters 7 and 19 capture more progressive central plays. However, to understand why these passes are consistently graded positively, we need more than just spatial information.
This is where Gradient’s in-depth event data comes in. For each pass, we can determine whether it broke an opponent line, was played under pressure, created an opportunity, or involved a specific pass type or ball height. Using this information, we examine the positively graded passes within each cluster and identify the common characteristics that explain what makes them difficult to execute well.
Table 1* summarizes both expected and new insights. Clusters 0 and 6 confirm our earlier findings as long-range passes, often switches or direct balls. Cluster 3 stands out for its high proportion of positively graded passes, characterized by long aerial switches that consistently create dangerous positions. Meanwhile, Cluster 10 includes ground through balls that break the defensive line, and Cluster 21 contains shorter passes that often penetrate the midfield and also lead to threat creation. Together, these patterns highlight how structural and contextual features combine to define high-quality passes.
Table 1* - Characteristics of positively graded passes from each cluster
*Not all clusters are visible in the table as they do not meet the minimum required rate of positively graded passes within the cluster
Combining our pass clusters and grading system, we can now analyze passing trends at the team level. This includes identifying which types of passes a team relies on most, which patterns they execute better than others, and which players consistently exceed expectations in build-up play.
To determine the five most characteristic pass patterns for each team, we measured how frequently each cluster was used relative to the rest of the league. Rather than relying on raw counts, we calculated z-scores for each cluster to capture overrepresentation, highlighting patterns that teams use more often than the average team. We then compared these high-usage clusters with those that had the highest rate of positively graded passes. This allowed us to distinguish between what teams do most and what they do best.
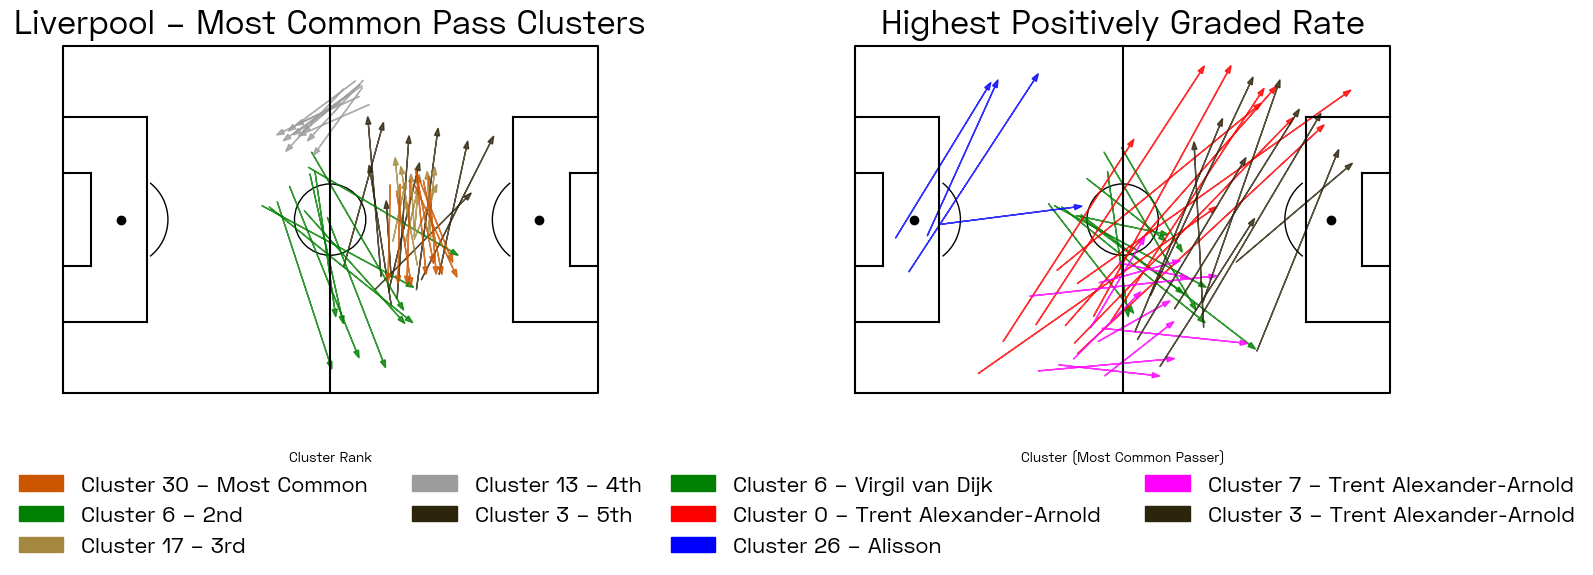
In Figure 4, we see that Liverpool frequently played short, lateral, or backward passes in build-up under Arne Slot, represented by Clusters 30, 17, and 13. These are often used to maintain possession and reset attacks. At the same time, Liverpool also made use of long switches to the wings, seen in Clusters 6 and 3. Notably, those same clusters also appear in Figure 5, which highlights the team’s most well-executed pass patterns. This suggests that Liverpool was playing to its strengths, some of their most common passes were played with quality execution.
We also observe that many of these high-quality passes come from key playmakers in their build up. Virgil van Dijk is the most frequent passer in Cluster 6, while Trent Alexander-Arnold dominates Cluster 3. In fact, Alexander-Arnold appears as the top passer in three of Liverpool’s top five positively graded clusters, reinforcing his central role in the team’s buildup. With his departure and the arrival of Jeremie Frimpong, a different profile of full back, it will be interesting to monitor how Liverpool’s passing patterns evolve next season.
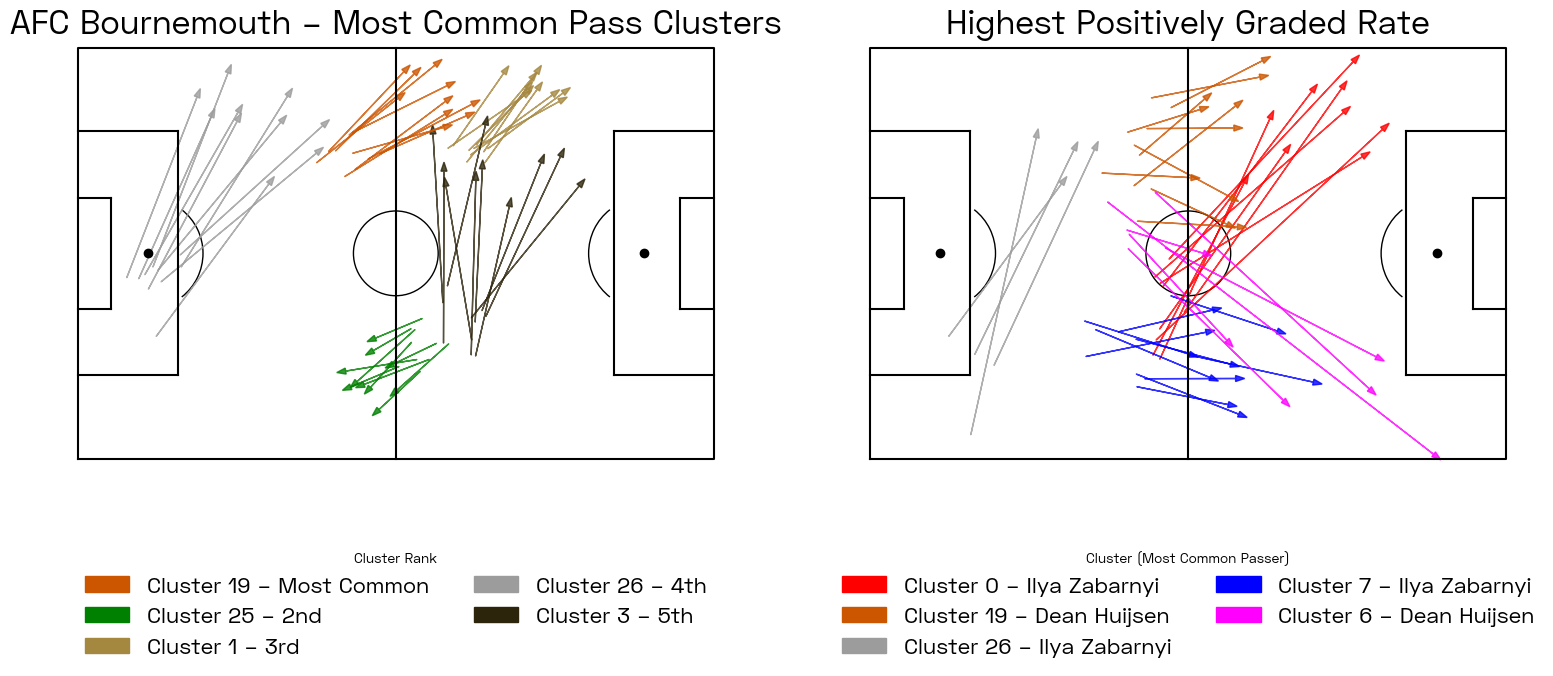
AFC Bournemouth is another interesting case to examine in regards to their passing profile, displaying a clear reliance on direct build-up play. Among all teams, they have the second longest average pass length (20.4 meters) across their five most frequently used clusters, trailing only Everton. This is evident in Figure 5, where most of their commonly used pass patterns, clusters 1, 3, 19 and 26 are longer range passes going towards the left flank. Interestingly, only one of these clusters (Cluster 19) overlaps with their five highest positively graded patterns. However, the positively graded clusters also reveal a similar direct approach, consisting of progressive passes from the backline into advanced areas. All of these high-difficulty passes are delivered by central defenders Ilya Zabarnyi and Dean Huijsen, suggesting a clear reliance on ball-playing center backs to initiate progression. With Huijsen completing a move to Real Madrid and Zabarnyi drawing interest in the transfer market, Bournemouth may face key structural questions heading into the season. If both are unavailable next season, Andoni Iraola will need to adjust his approach or identify defenders capable of consistently executing these difficult, line-breaking passes.
By combining spatial clustering with Gradient’s proprietary execution grades, we’ve developed a more nuanced understanding of how teams pass, not just in terms of volume and shape, but also in terms of quality and intent. This dual perspective allows us to highlight the structural foundations of team play while also identifying which patterns consistently deliver value.
Our findings show that some teams not only rely on specific clusters but also excel in executing them, while others may underutilize their most effective patterns. This type of analysis can offer actionable insights for coaching, recruitment, and opposition scouting.
Some potential next steps for study include:
• Track how team passing profiles evolve across a season or between managers
• Extend the analysis to include incomplete passes and, as an extension, negatively graded passes to analyze which pass types are riskier or if the risk is worth the reward for some pass groups
• Explore temporal and situational context, such as game state, opponent strength or press intensity
• Analyze passer receiver combinations within clusters to identify player pairings that consistently generate high-quality outcomes
Attached below is the top five pass clusters by positively graded rate for each Premier League team from the 2024/25 season: